EUR/USD Current price: 1.1053
View Live Chart for the EUR/USD
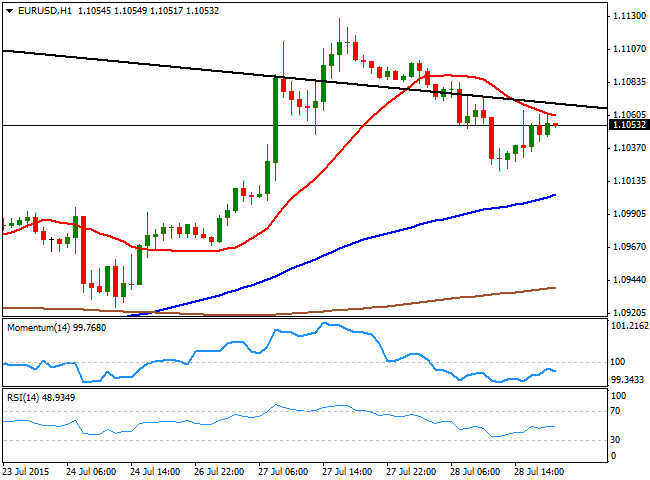
The EUR/USD pair gave back some of its Monday's gains, falling down to 1.1021 before bouncing some on the back of weaker-than-expected US consumer confidence figures. The pair started the day with a weaker note, slipping through the first half of the day with no macroeconomic news coming from Europe. EU officers however, announced that a deal between Greece and its creditors could be clinched by the ends of August, whilst the ECB approved a Greek proposal of reopening the local stock market, although no further details have been revealed. In the US, the service sector has posted a slight rebound, as the Markit Flash services PMI printed 55.2 in July from the previous 54.8. The market entered wait-and-see mode during the American afternoon, as investors wait for the upcoming FOMC monetary policy decision next Wednesday.
Technically, the 1 hour chart shows that the price has been unable to recover above its 20 SMA, whilst the technical indicators present a bearish tone, heading lower below their mid-lines. In the 4 hours chart, however, the upside remains constructive as the pair bounced from a bullish 20 SMA, whilst the technical indicators aim slightly higher above their mid-lines. Daily basis, the pair held above its 100 DMA, also keeping doors open for additional advances. Nevertheless at this point, the price needs to extend beyond the 1.1120 critical resistance level to be able to extend its weekly rally, which ultimately will depend on the US Central Bank.
Support levels: 1.1020 1.0990 1.0950
Resistance levels: 1.1080 1.1125 1.1160
EUR/JPY Current Price: 136.60
View Live Chart for the EUR/JPY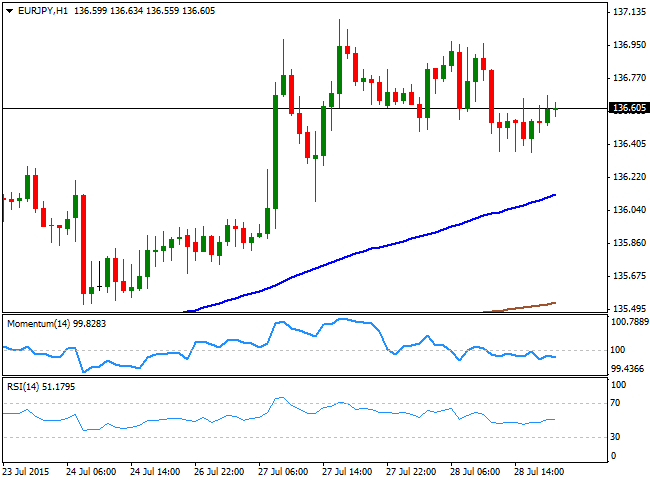
The EUR/JPY pair closed the day unchanged in the 136.60 region, as the dollar edged higher daily basis against both, the EUR and the JPY. Short term, the 1 hour chart shows that the 100 SMA extended higher below the current price, now offering an intraday support in the 136.20 region, although the technical indicators present a mild bearish tone below their mid-lines, inclining the balance towards the downside. In the 4 hours chart, a slightly bullish tone prevails, as the technical indicators aim higher above their mid-lines, albeit lacking upward momentum. As commented on previous updates, the pair needs to advance beyond the 137.80 region to actually turn bullish, a level that the pair will hardly reach during the upcoming sessions.
Support levels: 136.20 135.85 135.40
Resistance levels: 137.10 137.45 137.80
GBP/USD Current price: 1.5598
View Live Chart for the GPB/USD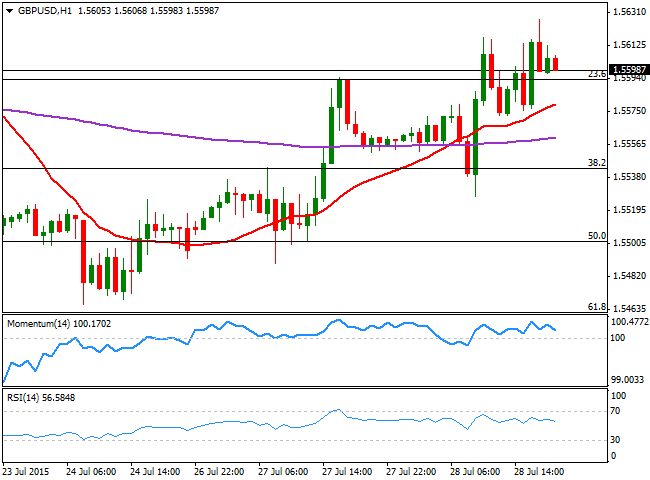
The GBP/USD pair surged to a fresh weekly high of 1.5627, with the Pound finding intraday demand after the release of the UK GDP figures for the second quarter of this 2015. The UK economy grew 0.7% in the mentioned period was in line with market's expectations, and above previous quarter reading of 0.4%. Reading in between lines however, the manufacturing sector declined 0.3% whilst the construction sector was unchanged, suggesting an uneven recovery. The pair eased intraday after peaking, but by the end of the day holds to its gains, hovering around the 1.5600 level. The short term technical picture presents a limited upward potential, as despite the price holds above a bullish 20 SMA, the technical indicators have turned lower, holding for now above their mid-lines. In the 4 hours chart, the technical indicators head higher above their mid-lines, whilst the price stands above flat moving averages that reflect the lack of upward strength.
Support levels: 1.5545 1.5500 1.5460
Resistance levels: 1.5625 1.5660 1.5710
USD/JPY Current price: 123.59
View Live Chart for the USD/JPY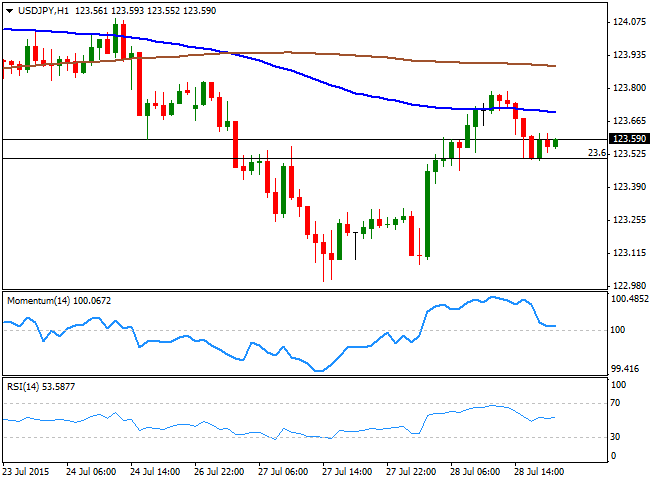
The USD/JPY pair recovered some ground this Tuesday, surging to a daily high of 123.78, before tepid US data pushed it slightly lower, closing the day, however, in the green. The pair remained confined within Monday's range and while the long term picture is bullish, as the daily chart shows that the price remains well above its moving averages whilst the technical indicators head north above their mid-lines, the intraday outlook remains neutral. In the 1 hour chart, the price has failed to advance beyond its 100 SMA, currently around 123.70, whilst the technical indicators stand horizontal above their mid-lines, lacking directional strength. In the 4 hours chart, the technical indicators aim slightly higher around their mid-lines, whilst the price is above its 100 and 200 SMAs, both converging around 123.25, signaling the absence of a dominant trend. The pair may get a boost from a hawkish FED, although investors may choose to take profits out if the price reaches 124.45, the level that has contained the upside for the last 2-months.
Support levels: 123.30 122.90 122.40
Resistance levels: 123.70 124.20 124.45
AUD/USD Current price: 0.7325
View Live Chart for the AUD/USD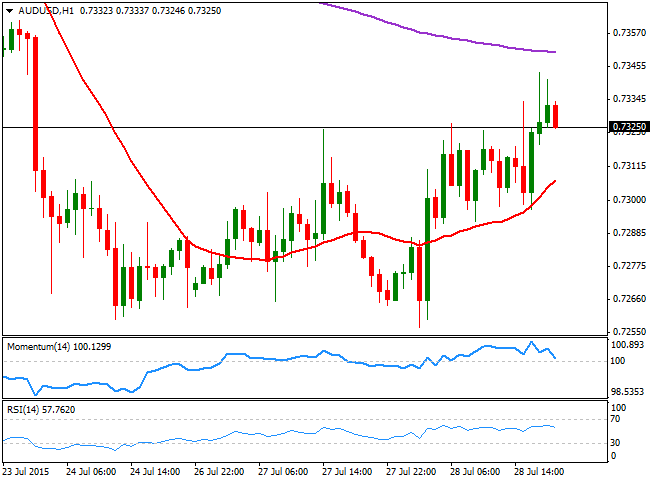
The Australian dollar fell to a fresh 6-year low of 0.7256 against the greenback, weighed by Chinese stocks as the Shanghai composite fall almost 10% since the week stated. A shy recovery in commodity prices alongside with weaker-than-expected US data, has helped the pair to bounce intraday up to 0.7343, holding above the 0.7300 level by the end of the day. The 1 hour chart shows that the price stands well above a bullish 20 SMA, albeit the technical indicators diverge south, approaching their mid-lines and pointing for further short term retracements. In the 4 hours chart, the price is above a bearish 20 SMA, whilst the technical indicators head north above their mid-lines, suggesting on contrary, some intraday advances. The background dominant trend is clearly bearish, which means investors will be waiting to sell on higher levels: approaches up to the 0.7400 level should then be understood as selling opportunities rather than a sign of further gains to come.
Support levels: 0.7300 0.7260 0.7225
Resistance levels: 0.7350 0.7390 0.7440
Recommended Content
Editors’ Picks
EUR/USD clings to gains above 1.0750 after US data

EUR/USD manages to hold in positive territory above 1.0750 despite retreating from the fresh multi-week high it set above 1.0800 earlier in the day. The US Dollar struggles to find demand following the weaker-than-expected NFP data.
GBP/USD declines below 1.2550 following NFP-inspired upsurge

GBP/USD struggles to preserve its bullish momentum and trades below 1.2550 in the American session. Earlier in the day, the disappointing April jobs report from the US triggered a USD selloff and allowed the pair to reach multi-week highs above 1.2600.
Gold struggles to hold above $2,300 despite falling US yields

Gold stays on the back foot below $2,300 in the American session on Friday. The benchmark 10-year US Treasury bond yield stays in negative territory below 4.6% after weak US data but the improving risk mood doesn't allow XAU/USD to gain traction.
Bitcoin Weekly Forecast: Should you buy BTC here? Premium

Bitcoin (BTC) price shows signs of a potential reversal but lacks confirmation, which has divided the investor community into two – those who are buying the dips and those who are expecting a further correction.
Week ahead – BoE and RBA decisions headline a calm week

Bank of England meets on Thursday, unlikely to signal rate cuts. Reserve Bank of Australia could maintain a higher-for-longer stance. Elsewhere, Bank of Japan releases summary of opinions.