EUR/USD Current price: 1.0884
View Live Chart for the EUR/USD
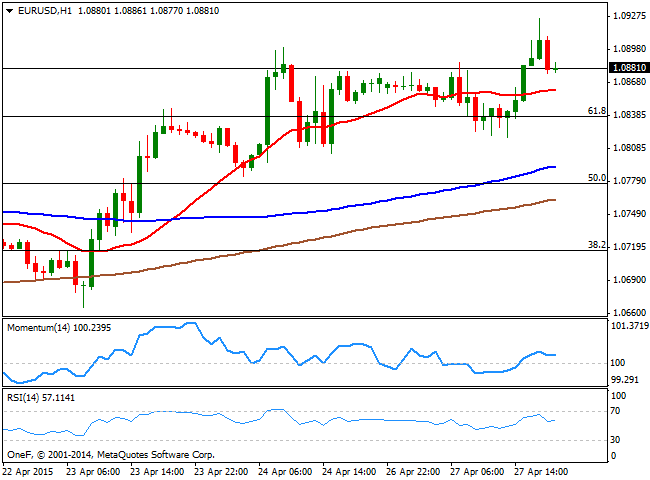
Having started the day with a positive tone, the dollar reversed its course in the American afternoon and the EUR/USD pair rose as high as 1.0925 before settling below the 1.0900 mark. There was no relevant data in the Euro zone, and early dollar strength was attributed to growing concerns over the uncertainty on Greece´s future, after the country failed to reach an agreement with the rest of the Euro group during the meeting developed in Riga this last weekend. But the American currency was hit by worse-than-expected US data, as the service sector grew less than expected in April, printing 57.8 against 59.2 in March, whilst the Dallas Fed Manufacturing Business Index for the same month came out at -16, against a -14 expected. Furthermore, the Greek government announced a reshuffle of its negotiating team, taking the leading role away from Finance Minister Varoufakis. The negotiations will now be in the hands of the deputy Foreign Minister, Tsakalotos, whilst Varoufakis role is now limited to supervise negotiations. Investors are seeing the change as a clear sign that Greece wants to reach a deal, particularly after Varoufakis was reviled by its counterparts in the media last Friday.
Later on in the week, the FOMC is expected to maintain its economic policy unchanged, another factor weighing on the USD. Technically, the 1 hour chart shows that the price holds above a flat 20 SMA, whilst the technical indicators are holding in positive territory without a clear directional strength. In the 4 hours chart the latest candle presents a long upward wick, reflecting strong selling interest surging at higher levels, whilst the technical indicators are turning slightly lower in positive territory, albeit the 20 SMA maintains a strong bullish slope below the current price, currently around 1.0820. Renewed buying interest above the 1.0910 level should keep the pair in the bullish bias, eyeing a retest of the 1.1000 figure for this Tuesday.
Support levels: 1.0860 1.0820 1.0770
Resistance levels: 1.0910 1.0950 1.1000
EUR/JPY Current price: 129.58
View Live Chart for the EUR/JPY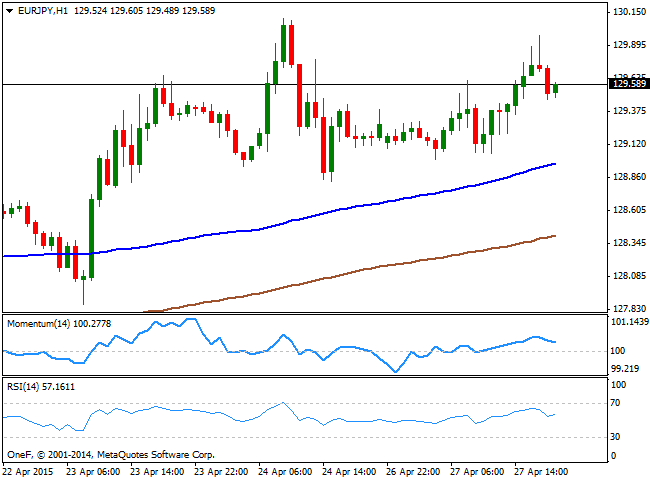
The EUR/JPY has shown little progress this Monday, with the pair finding again selling interest near the 130.00 figure, but trading within Friday's range. According to the 1 hour chart, the pair maintains a mild positive tone, as the price continues to add above its 100 and 200 SMAs, with the shortest now heading higher around 129.00. In the same chart, the technical indicators have partially lows their upward strength but hold well above their mid-lines. In the 4 hours chart, the price stands above a flat 200 SMA whilst the technical indicators have also turned lower, but remain above their mid-lines, giving not much clues on what's next for the pair. As commented on previous updates, the price needs to firm up above the 130.00 level to be able to post more sustainable gains, up to the 131.10 level, whilst below 129.00 the risk turns towards the downside.
Support levels: 129.45 129.00 128.55
Resistance levels: 130.00 130.50 131.10
GBP/USD Current price: 1.5233
View Live Chart for the GBP/USD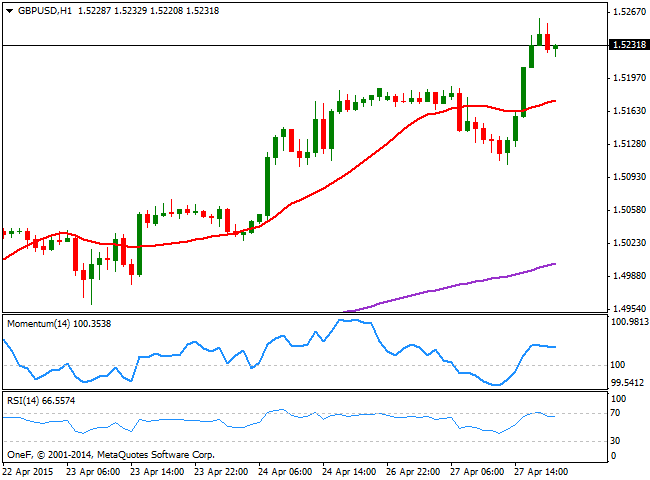
The British Pound surge to a fresh 8-week high against the dollar of 1.5260, following broad dollar weakness and renewed market's confidence in a Greek deal. There was no relevant data released in the UK this Monday, but the kingdom will publish its GDP readings for the first quarter of 2015 early Tuesday. The economy is expected to have grew 0.7% against previous quarter growth of 0.8%, whilst the annualized figured is expected to print 2.6%, supporting the ongoing Pound strength, should the readings meet expectations. Technically, the 1 hour chart shows that the pair stands near the high after a limited downward correction, with the price firm well above its 20 SMA and that the technical indicators are losing upward strength near overbought levels. In the 4 hours chart the 20 SMA maintains a strong bullish slope, currently around 1.5106, the daily low, whilst the Momentum indicator turns slightly lower well into positive territory, whilst the RSI indicator aims higher around 72, all of which supports some consolidation in the short term, ahead of further gains, to be confirmed with a break above the mentioned daily high.
Support levels: 1.5090 1.5050 1.5010
Resistance levels: 1.5150 1.5200 1.5240
USD/JPY Current price: 119.03
View Live Chart for the USD/JPY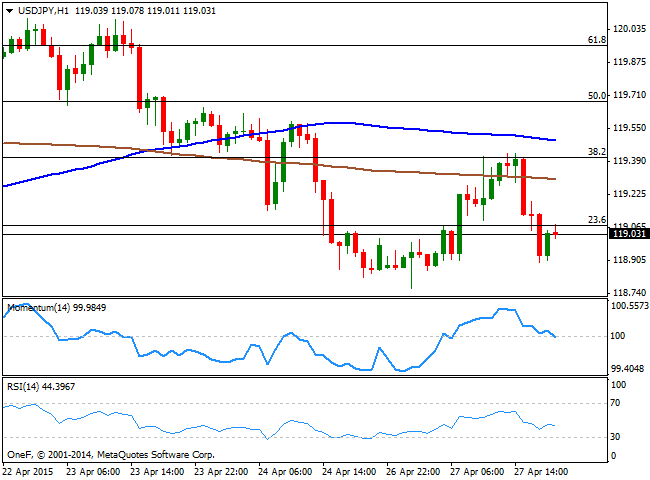
The yen strengthened on Monday, despite the Flitch rating agency downgraded Japan's Long-Term Foreign and Local Currency Issuer Default Ratings (IDRs) to 'A' from 'A+', keeping the outlook of the country at stable. The news favored a recovery in the pair that reached a daily high of 119.42. But tepid US data sent the pair back lower, maintaining the overall bearish tone intact. From a technical point of view, the 1 hour chart shows that the price stalled at the 38.2% retracement of its latest bearish run around the mentioned daily high, and trades now right below the 23.6% retracement of the same rally. In the same chart, the price stands well below its 100 and 200 SMAs, whilst the Momentum indicator retraced sharply lower from overbought levels and aims to cross the 100 level to the downside, whilst the RSI hovers around 45. In the 4 hours chart the Momentum indicator aims higher below 100, but the RSI indicator has already turned south around 44, all of which favors additional declines towards the 118.52 level, the low posted last April 20.
Support levels: 118.50 118.10 117.70
Resistance levels: 119.50 120.00 120.40
AUD/USD Current price: 0.7855
View Live Chart for the AUD/USD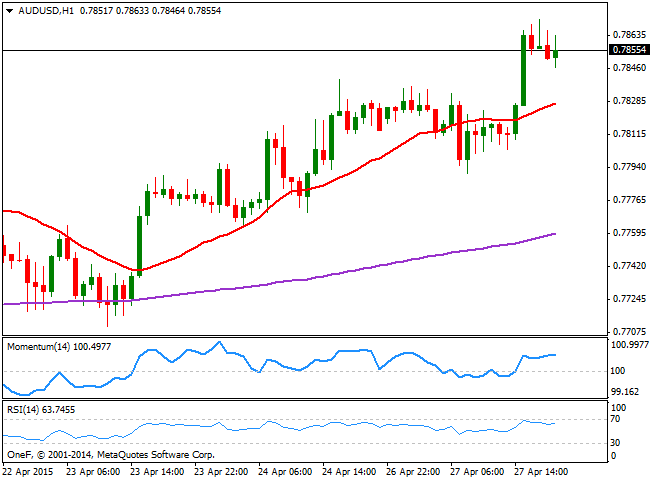
The Australian dollar has been on demand since early in the Asian session, with the AUD/USD advancing to a fresh 5-week high of 0.7872 in the American afternoon. Earlier in the day, RBA governor Stevens was due to speak at the Australian Financial Review Banking & Wealth Summit, in Sydney, albeit triggered no market reaction at the time. Nevertheless the Central Bank is due to have its monthly economic meeting next week, and market expectations are favoring a possible rate cut. In the meantime, the 1 hour chart shows that the price extended above its 20 SMA that now presents a bullish slope below the current level, whilst the technical indicators are partially retracing above their mid-lines, following price action. In the 4 hours chart the price is also well above a bullish 20 SMA, albeit the technical indicators have lost their upward strength. The immediate support stands at 0.7840, where the pair presents several highs from these last few weeks, and a break below it should signal additional short term declines. If buyers surge around it however, there's scope for an advance up to 0.7937, March 24 daily high.
Support levels: 0.7840 0.7800 0.7760
Resistance levels: 0.7890 0.7940 0.7990
Recommended Content
Editors’ Picks
EUR/USD clings to gains above 1.0750 after US data

EUR/USD manages to hold in positive territory above 1.0750 despite retreating from the fresh multi-week high it set above 1.0800 earlier in the day. The US Dollar struggles to find demand following the weaker-than-expected NFP data.
GBP/USD declines below 1.2550 following NFP-inspired upsurge

GBP/USD struggles to preserve its bullish momentum and trades below 1.2550 in the American session. Earlier in the day, the disappointing April jobs report from the US triggered a USD selloff and allowed the pair to reach multi-week highs above 1.2600.
Gold struggles to hold above $2,300 despite falling US yields

Gold stays on the back foot below $2,300 in the American session on Friday. The benchmark 10-year US Treasury bond yield stays in negative territory below 4.6% after weak US data but the improving risk mood doesn't allow XAU/USD to gain traction.
Bitcoin Weekly Forecast: Should you buy BTC here? Premium

Bitcoin (BTC) price shows signs of a potential reversal but lacks confirmation, which has divided the investor community into two – those who are buying the dips and those who are expecting a further correction.
Week ahead – BoE and RBA decisions headline a calm week

Bank of England meets on Thursday, unlikely to signal rate cuts. Reserve Bank of Australia could maintain a higher-for-longer stance. Elsewhere, Bank of Japan releases summary of opinions.