EUR/USD Current price: 1.0728
View Live Chart for the EUR/USD
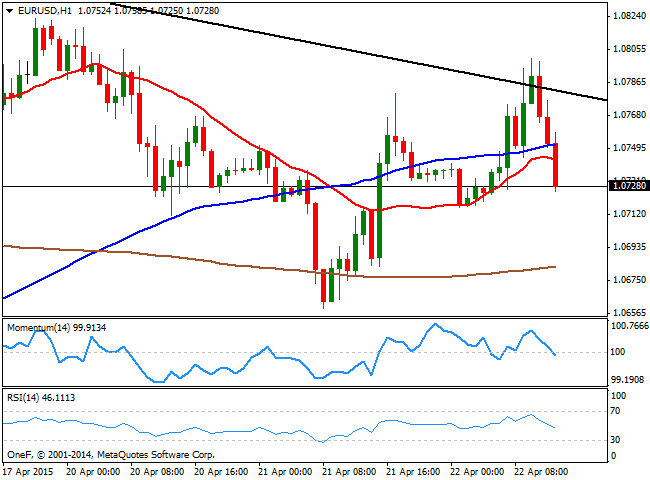
News that Greece has cash enough to face its upcoming maturities and won't have financial issues until late June, has brought relief to the common currency that advanced up to 1.0800. Sellers however surged around the critical figure, sending the pair back lower ahead of the US opening. Market's mood has found also support from better-than-expected inflation readings in Australia, released during the past Asian session, sending the dollar generally lower across the board. In Europe, Italy released its monthly inflation readings, slightly above expectations and also supportive of a EUR rally. Nevertheless, and despite broad dollar weakness, the EUR retraces sharply alongside with the CHF, on news the SNB announced pension funds can be subject to negative rates. Technically, the 1 hour chart shows that the price broke below its 20 and 100 SMAs, now the immediate support level around 1.0745, whilst the technical indicators are aiming higher and breaking below their mid-lines. In the 4 hours chart, a mild negative tone prevails, as the technical indicators head lower below their mid-lines, whilst the price stands below its moving averages. Addional declines below 1.0715 should lead to a stronger decline, eyeing 1.0630 as a probable daily low.
Support levels: 1.0715 1.0680 1.0630
Resistance levels: 1.0770 1.0810 1.0850
GBP/USD Current price: 1.5072
View Live Chart for the GBP/USD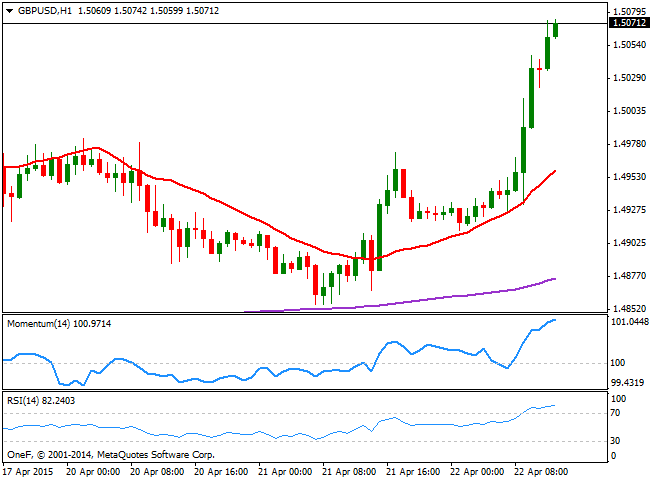
The British Pound soared against the greenback to a fresh 6-week high following the release of the Bank of England Minutes, showing that all MPC members voted to keep interest rates and the APP unchanged, but also agreed that the next rate move will likely be an increase. The Central Bank also warned that inflation may fall into negative territory during the upcoming months, but is also confident it will pick up during 2016. Despite the Bank did not clarify when the so long awaited rate hike may take place, the market decided anyway to buy the GBP. Trading near its daily highs, the risk of a hung Parliament in upcoming May elections should see limited Pound gains over the upcoming days. However, the short term picture maintains a strong bullish tone, with the 1 hour chart showing that the technical indicators continue to head higher despite in extreme overbought levels, whilst the price advanced above its 20 SMA. In the 4 hours chart, the Momentum indicator heads strongly higher above its mid-line, supporting the shorter term view, with the next short term resistance at the 1.5100 level.
Support levels: 1.5040 1.5000 1.4970
Resistance levels: 1.5100 1.5130 1.5165
USD/JPY Current price: 119.57
View Live Chart for the USD/JPY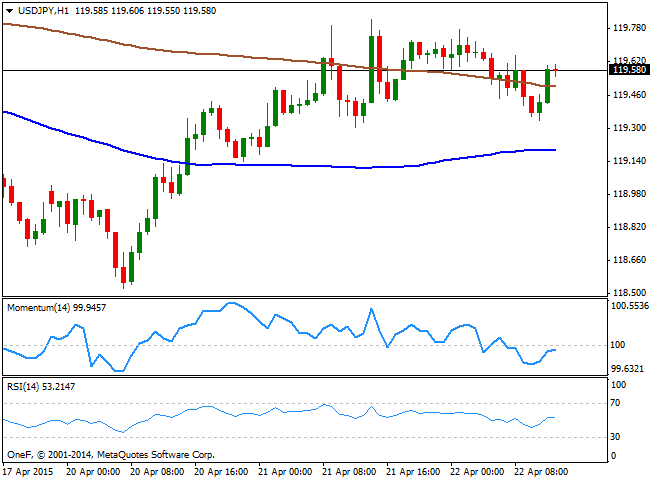
The USD/JPY pair continues to trade uneventfully in the 119.50 region, having been confined to a limited range for most of this week. The 1 hour chart presents a limited bearish tone, as the technical indicators are retracing in negative territory after failing around their mid-lines whilst the price hovers around a bearish 200 SMA. In the same chart, the 100 SMA offers support in the 119.20 level, albeit both moving averages are quite horizontal, reflecting the lack of directional strength. In the 4 hours chart the technical indicators head strongly higher above their mid-lines, but the price is unable to settle above its 100 SMA, currently around 119.70.
Support levels: 119.20 118.90 118.50
Resistance levels: 119.80 120.10 120.50
AUD/USD Current price: 0.7783
View Live Chart for the AUD/USD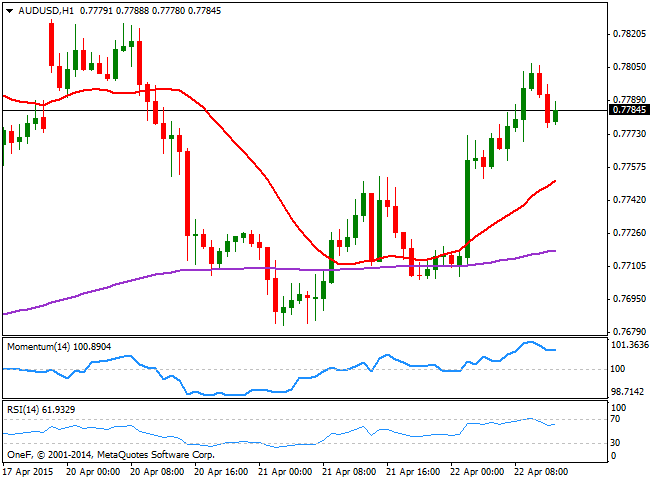
The Australian dollar got a nice boost from local inflation figures, as trimmed inflation yearly basis, rose to 2.3%, diminishing chances of a sooner rate cut in the country. The AUD/USD pair surged to a daily high of 0.7806, consolidating near the high ahead of the US opening. The 1 hour chart shows that the 20 SMA maintains a strong bullish slope below the current level, currently in the 0.7740 region, whilst the technical indicators are regaining the upside in positive territory after correcting overbought readings. In the 4 hours chart however, the technical readings maintain a neutral stance, with the 20 SMA flat around 0.7750 and the technical indicators directionless around their mid-lines. Renewed buying interest above the mentioned high should lead to an advance up to the 0.7845 price zone, this month highs, while the bearish pressure should increase if the price loses the mentioned 0.7740 level.
Support levels: 0.7740 0.7685 0.7640
Resistance levels: 0.7800 0.7840 0.7890
Recommended Content
Editors’ Picks
Fed statement language and QT strategy could drive USD action – LIVE

The US Federal Reserve is set to leave the policy rate unchanged after April 30 - May 1 policy meeting. Possible changes to the statement language and quantitative tightening strategy could impact the USD's valuation.
EUR/USD stays below 1.0700 as focus shifts to Fed policy decisions

EUR/USD stays in its daily range below 1.0700 following the mixed macroeconomic data releases from the US. Private sector rose more than expected in April, while the ISM Manufacturing PMI fell below 50. Fed will announce monetary policy decisions next.
GBP/USD holds steady below 1.2500 ahead of Fed

GBP/USD is off the lows but stays flatlined below 1.2500 on Wednesday. The US Dollar stays resilient against its rivals despite mixed data releases and doesn't allow the pair to stage a rebound ahead of the Fed's policy decisions.
Gold rebounds above $2,300 after US data, eyes on Fed policy decision

Gold gained traction and recovered above $2,300 in the American session on Wednesday. The benchmark 10-year US Treasury bond yield turned negative on the day after US data, helping XAU/USD push higher ahead of Fed policy announcements.
A new stage of Bitcoin's decline

Bitcoin's closing price on Tuesday became the lowest since late February, confirming the downward trend and falling under March and April support and the psychologically important round level.