EUR/USD Current price: 1.0376
View Live Chart for the EUR/USD
In quite a volatile journey, the dollar ended down across the board, as more local weak data alongside with rising stocks and risk appetite, finally took their toll over the American currency. Earlier in the day, the ECB has had its monetary policy meeting, leaving rates and QE unchanged, and if something, there was a slightly change in wording, as President Mario Draghi stated that " QE will continue until sustained adjustment in inflation" is reached, meaning it will likely extend beyond September 2016, something the market has already priced in. The US economy can take a breath, as data released this Wednesday shows that the New York Empire State manufacturing index came out negative at -1.19 against the 7.0 expected, whilst Industrial Production figures for March, also missed expectations. The only "positive" news, was that oil´s stocks grew by far less than expected, only 1.3M last week, triggering a rally in the commodity which resulted in additional weight over the greenback. Later on in the day, during the American afternoon, the Beige Book showed that growth continued across most of the U.S. in February-March, halting the sell-off by the end of the day.
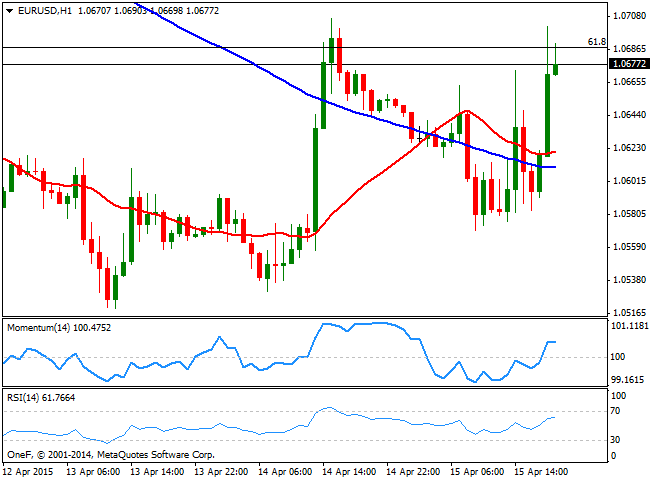
Technically, the short term picture is bullish, albeit the pair stalled once again around 1.0700 and consolidates a few pips below the 61.8% retracement of its latest bullish run at 1.0690. The 1 hour chart shows that the price extended above its 20 and 100 SMAs, both in the 1.0610/20 region, whilst the technical indicators are losing upward strength well into positive territory. In the 4 hours chart the price remains well above a flat 20 SMA, while the technical indicators maintain a strong bullish slope, supporting additional advances particularly if the pair manages to extend beyond 1.0710.
Support levels: 1.0650 1.0600 1.0550
Resistance levels: 1.0710 1.0755 1.0800
EUR/JPY Current price: 126.86
View Live Chart for the EUR/JPY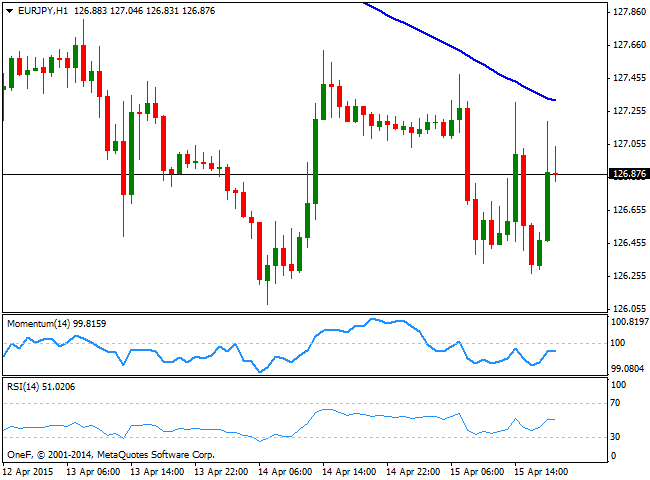
The EUR/JPY cross traded range bound for most of the day, as the day was all about dollar self weakness. The EUR/JPY trades a few pips below its opening level, and the 1 hour chart shows that the price continues to develop below a bearish 100 SMA, currently in the 127.30 region, whilst the technical indicators are losing upward potential below their mid-lines, suggesting limited chances for an upward rally. In the 4 hours chart the pair trades far below its 100 and 200 SMAs, whilst the technical indicators aim higher below their mid-lines, still far from providing a buying intraday signal. The pair needs to post some sustainable gains beyond the mentioned 127.30 region to be able to advance towards the 128.10 price zone.
Support levels: 126.50 126.10 125.60
Resistance levels: 127.30 127.65 128.10
GBP/USD Current price: 1.4839
View Live Chart for the GBP/USD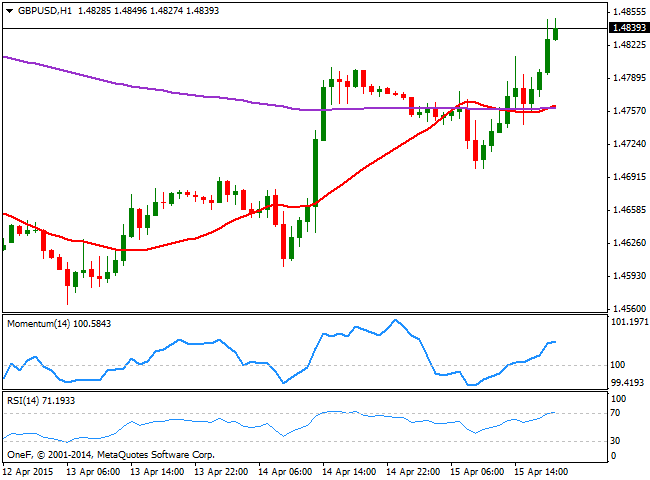
The GBP/USD pair trades at fresh weekly highs, having reached a daily highs of 1.4849, on broad dollar weakness. There were no fundamental releases in the UK, and there won't be anything relevant until Friday, when the kingdom will publish its monthly economic figures for March, expected to show a limited improvement compared to February readings. Technically, the 1 hour chart shows that the upside is still favored, as the price advanced well beyond its 20 SMA after falling briefly below it during the Asian session, whilst the technical indicators continue to head higher above their mid-lines. In the 4 hours chart the 20 SMA heads strongly higher around the 1.4700 level, while the technical indicators maintain a strong bullish momentum well above their mid-lines, supporting additional advances should the price accelerate beyond the 1.4850 level. A decline below 1.4805 on the other hand, should deny the upward continuation and see the pair easing towards the 1.4700/35 price zone.
Support levels: 1.4805 1.4770 1.4735
Resistance levels: 1.4850 1.4890 1.4925
USD/JPY Current price: 118.91
View Live Chart for the USD/JPY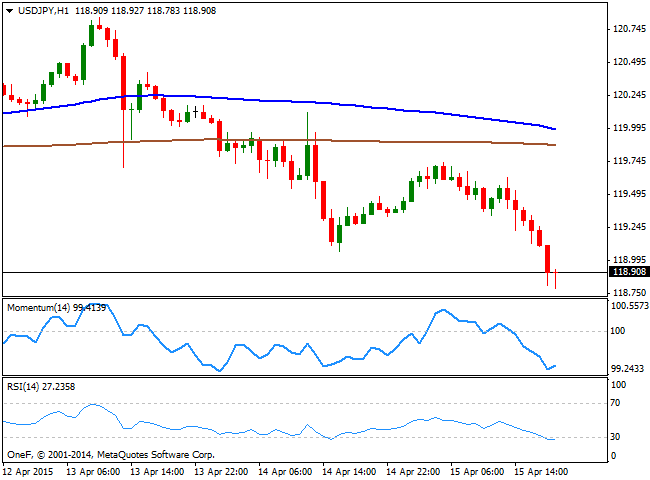
The Japanese yen strengthened further against its American rival, with the USD/JPY pair breaking below the 119.00 level, and barely holding above the 118.70/80 price zone, where the pair halted its decline during the last three weeks. The short term picture shows that the bearish momentum can make a pause, as the technical indicators are posting limited bounces from oversold levels, albeit the price remains well below its moving averages. In the 4 hours chart however, the technical indicators maintain a strong bearish momentum, whilst the price has retraced further below from its 100 SMA. But the most relevant reading comes from the daily chart, as the pair is trying to break below its 100 DMA for the third time in less than a month. The mentioned moving average stands at 119.35, and the lowest low posted below it stands at 118.32, which means large stops should lie below it, and therefore a break through it should trigger a strong downward continuation.
Support levels: 118.80 118.35 118.00
Resistance levels: 119.35 119.65 120.00
AUD/USD Current price: 0.7677
View Live Chart for the AUD/USD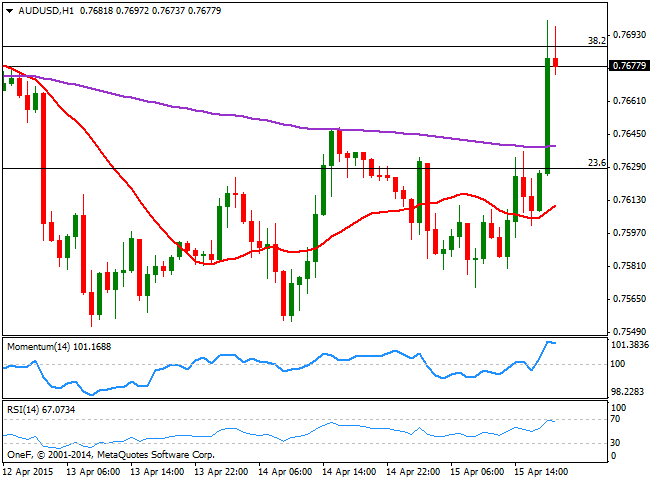
The AUD/USD pair surged up to the 0.7700 level, maintaining a strong positive tone and finding support in rising commodities and equities, as the gold price recovered above the $1,200 an ounce level. Current Aussie strength will have to face critical macroeconomic readings during the upcoming Asian session, as the country will release its monthly employment figures for March, pretty much unchanged from February ones, and Consumer Inflation expectations for April, last at 3.2%. Up beating figures can push the pair through the 0.7740 price zone, 50% retracement of the pair's latest bearish run, and this month high, a key resistance level. In the meantime, the 1 hour chart shows that the 20 SMA heads north below the current price albeit the technical indicators are giving signs of exhaustion in overbought territory, anticipating at least some consolidation ahead of the news. In the 4 hours chart the technical indicators have also lost their upward strength, but remain in positive territory, whilst the 20 SMA stands flat around 0.7610.
Support levels: 0.7660 0.7625 0.7590
Resistance levels: 0.7700 0.7740 0.7795
Recommended Content
Editors’ Picks
EUR/USD clings to gains above 1.0750 after US data

EUR/USD manages to hold in positive territory above 1.0750 despite retreating from the fresh multi-week high it set above 1.0800 earlier in the day. The US Dollar struggles to find demand following the weaker-than-expected NFP data.
GBP/USD declines below 1.2550 following NFP-inspired upsurge

GBP/USD struggles to preserve its bullish momentum and trades below 1.2550 in the American session. Earlier in the day, the disappointing April jobs report from the US triggered a USD selloff and allowed the pair to reach multi-week highs above 1.2600.
Gold struggles to hold above $2,300 despite falling US yields

Gold stays on the back foot below $2,300 in the American session on Friday. The benchmark 10-year US Treasury bond yield stays in negative territory below 4.6% after weak US data but the improving risk mood doesn't allow XAU/USD to gain traction.
Bitcoin Weekly Forecast: Should you buy BTC here? Premium

Bitcoin (BTC) price shows signs of a potential reversal but lacks confirmation, which has divided the investor community into two – those who are buying the dips and those who are expecting a further correction.
Week ahead – BoE and RBA decisions headline a calm week

Bank of England meets on Thursday, unlikely to signal rate cuts. Reserve Bank of Australia could maintain a higher-for-longer stance. Elsewhere, Bank of Japan releases summary of opinions.