EUR/USD Current price: 1.0732
View Live Chart for the EUR/USD
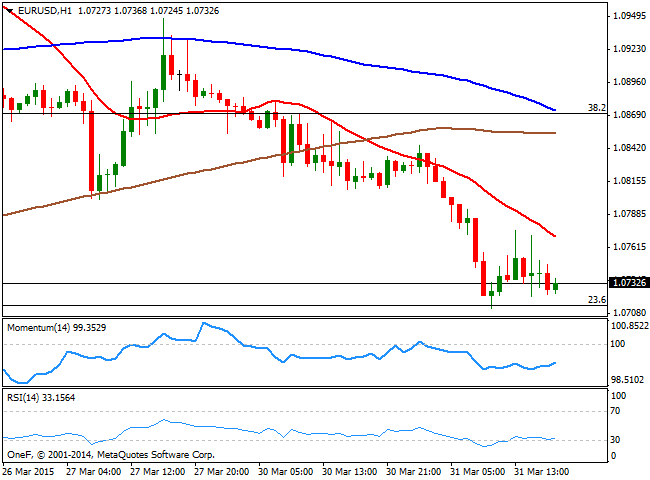
The last day of this first quarter of 2015 ends with the dollar generally higher across the board. The day started with China announcing easing measures to boost the local housing market, which resulted in some risk appetite that saw most of the Asian share markets closing higher and supported strong initial gains in stocks. But as the day went by, stocks reversed sharply in Europe, whilst US indexes closed in the red. Fundamentally, news were for the most positive in Europe, with German unemployment down to a record low of 6.5% in March, and the Euro zone inflation climbing to minus 0.1% in the same month, up from minus 0.3% in February. The inflationary figures may bring some relief to the ECB, and anticipate it could become a non-event for the forex market. In the US, consumer confidence climbed to 101.3 in March, although Chicago PMI remained below 50, printing 46.3.
Dollar strength however, may have more to do with quarter-end fixing and upcoming US Nonfarm Payrolls data next Friday. Technically, the EUR/USD pair fell down to the 23.6% retracement of the 1.1533/1.0461 slide, reaching a daily low of 1.0712 before recovering some ground, consolidating for most of the last two sessions below the 1.0780 area. The 1 hour chart shows that the price extended further below its moving averages, while the technical indicators aim higher from oversold readings, but remain below their mid-lines. In the 4 hours chart technical readings are biased lower in negative territory, whilst the 20 SMA offers dynamic resistance in the 1.0850 price zone, supporting additional declines should the price break below the mentioned daily low.
Support levels: 1.0710 1.0660 1.0620
Resistance levels: 1.0760 1.0800 1.0840
EUR/JPY Current price: 129.97
View Live Chart for the EUR/JPY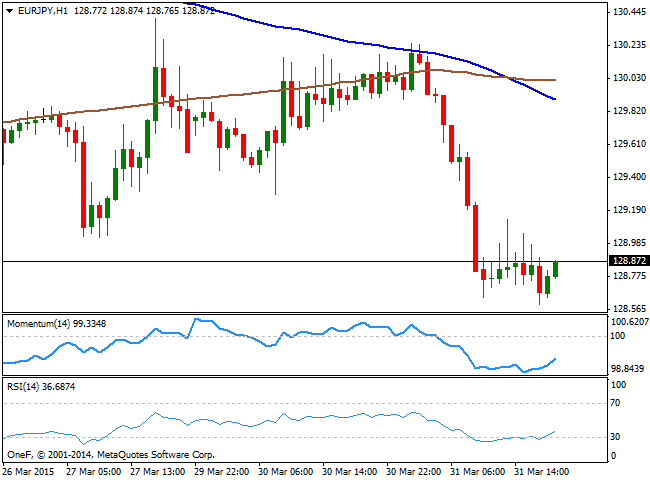
The yen saw a limited advance in the last day of its fiscal year, as if often the case, was impacted by some repatriation and profits booking. The EUR/JPY cross was dragged lower by EUR weakness that resulted in a fresh 2-week low of 128.59, with the pair trading a few pips above the level by US close. From a technical point of view, the downside is still favored, as the price develops below its moving averages, with the 100 SMA crossing below the 200 SMA in the 130.00 price zone, and the technical indicators barely bouncing from oversold territory. In the 4 hours chart, the price extended below the 100 SMA, the Momentum indicator heads lower below 100 and the RSI stands flat around 33, all of which keeps the risk towards the downside.
Support levels: 129.75 129.30 128.80
Resistance levels: 130.35 130.80 131.20
GBP/USD Current price: 1.4849
View Live Chart for the GBP/USD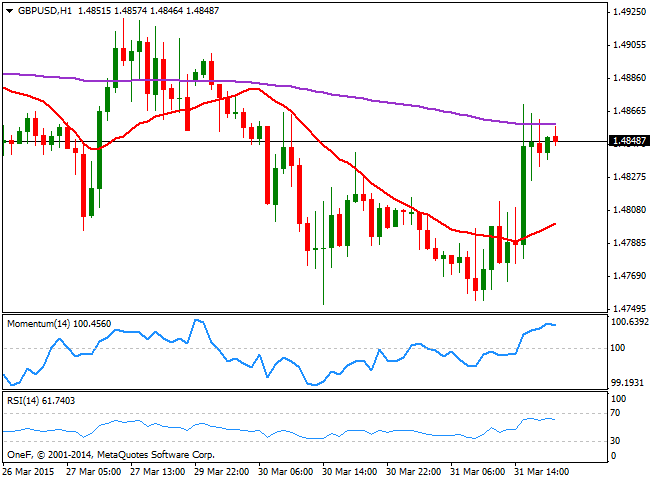
The GBP/USD pair staged a strong comeback at the beginning of the American session, after finding again buying interest around the 1.4750 level. Earlier in the day, the UK GDP final revision for the Q4 of 2014 surprised to the upside, reaching 0.6%, which was enough to halt the early slide triggered by broad dollar strength. The positive news supported the British Pound, albeit the movement was linked more to a jump in oil prices and quarter-end fixing than the news itself. Anyway, the picture has turned short term bullish for the pair, as the 1 hour chart shows that the price advanced above its 20 SMA, now gaining bullish slope in the 1.4800 area, whilst the technical indicators maintain a mild positive tone well above their mid-lines. In the 4 hours chart, and despite the price stands above a flat 20 SMA, the upside seems limited as the technical indicators are losing upward strength below their mid-lines.
Support levels: 1.4830 1.4800 1.4760
Resistance levels: 1.4890 1.4925 1.4950
USD/JPY Current price: 119.92
View Live Chart for the USD/JPY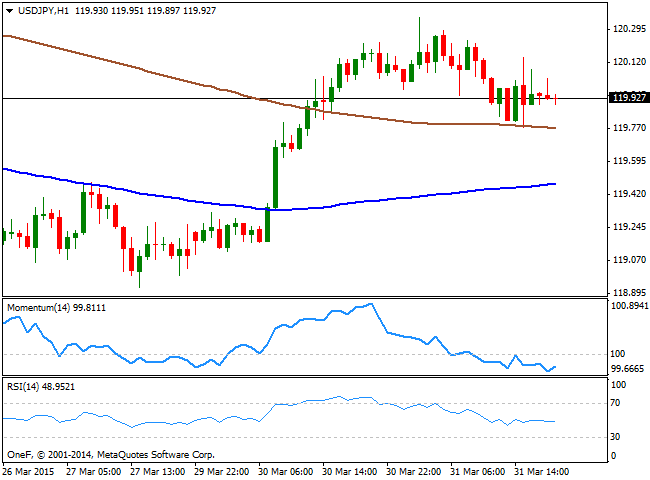
The USD/JPY pair was unable to sustain gains beyond the 120.00, having retraced from a daily high of 120.35 reached early in the Asian session. The pair however, found some short term buying interest in the 119.80 price zone, consolidating in a tight range for most of the American session. Technically, the 1 hour chart shows that the price held above its 200 SMA, while the 100 SMA offers the next intraday support around 119.40. In the same chart, the technical indicators lack directional strength below their mid-lines. In the 4 hours chart, the price struggles around a flat 200 SMA, although the technical indicators maintain their bullish slopes above their mid-lines, limiting chances of a stronger decline in the short term. At this point, the price needs to advance beyond 120.45, a strong static resistance level, to anticipate further advances towards the 121.00 level.
Support levels: 119.80 119.40 119.00
Resistance levels: 120.45 120.80 121.20
AUD/USD Current price: 0.7617
View Live Chart for the AUD/USD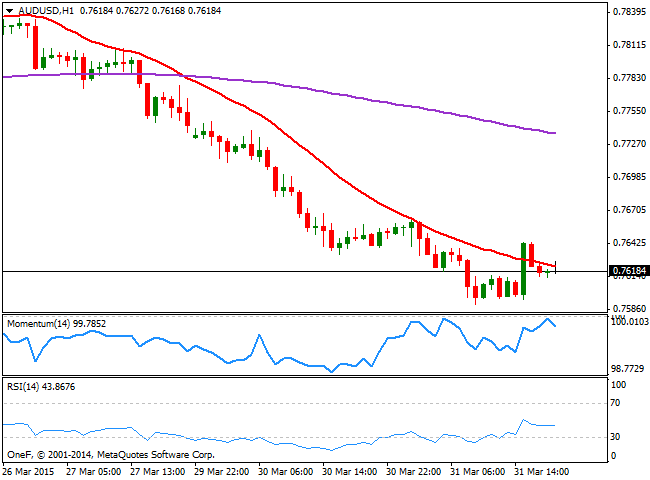
The Australian dollar fell down to a fresh 3-week low against the greenback, with the pair reaching 0.7590 as expectations continue growing for another rate cut from the RBA next week, and commodities fell sharply, with iron ore, the nation’s biggest export, plunging to a decade low. The AUD/USD pair maintains the bearish tone in the short term, with the 1 hour chart showing price unable to extend above the 20 SMA, a few pips above the current level, while the Momentum indicator retraces from the 100 level and the RSI heads lower around 43. In the 4 hours chart the 20 SMA maintains a sharp bearish slope well above the current price, whilst the technical indicators remain in oversold territory. The pair may correct higher due to the continued decline seen over these last few days, although selling interest will likely surge at higher levels as the bears remain in control.
Support levels: 0.7590 0.7555 0.510
Resistance levels: 0.7625 0.7660 0.7700
Recommended Content
Editors’ Picks
EUR/USD clings to gains above 1.0750 after US data

EUR/USD manages to hold in positive territory above 1.0750 despite retreating from the fresh multi-week high it set above 1.0800 earlier in the day. The US Dollar struggles to find demand following the weaker-than-expected NFP data.
GBP/USD declines below 1.2550 following NFP-inspired upsurge

GBP/USD struggles to preserve its bullish momentum and trades below 1.2550 in the American session. Earlier in the day, the disappointing April jobs report from the US triggered a USD selloff and allowed the pair to reach multi-week highs above 1.2600.
Gold struggles to hold above $2,300 despite falling US yields

Gold stays on the back foot below $2,300 in the American session on Friday. The benchmark 10-year US Treasury bond yield stays in negative territory below 4.6% after weak US data but the improving risk mood doesn't allow XAU/USD to gain traction.
Bitcoin Weekly Forecast: Should you buy BTC here? Premium

Bitcoin (BTC) price shows signs of a potential reversal but lacks confirmation, which has divided the investor community into two – those who are buying the dips and those who are expecting a further correction.
Week ahead – BoE and RBA decisions headline a calm week

Bank of England meets on Thursday, unlikely to signal rate cuts. Reserve Bank of Australia could maintain a higher-for-longer stance. Elsewhere, Bank of Japan releases summary of opinions.