EUR/USD Current price: 1.0877
View Live Chart for the EUR/USD

The American dollar staged a strong comeback last Thursday, erasing all of its weekly losses against most of its rivals. Nevertheless, the fate of the greenback has not yet been defined, as it stands far from its year highs posted earlier this March. Hopes the FED will raise rates in June, got diluted after the latest Central Bank meeting, with weak US macroeconomic data reinforcing the idea of a delay: stocks soared, helped also by ECB's QE, and the greenback took a dive. But so far, the movement seems mostly corrective, and a bottom has not been yet confirmed.
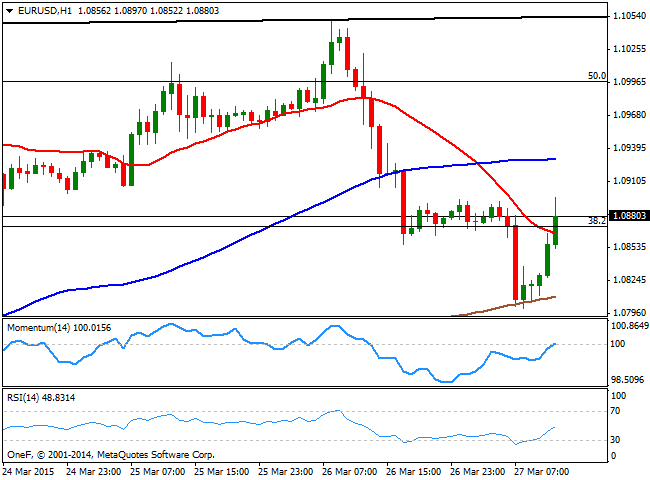
After the US GDP release, the EUR/USD pair trades above the 1.0865 level 38.2% retracement of its latest bearish run, with the short term picture showing that the indicators remain below their midlines and the price below aiming to advance above the 20 SMA, having found some short term buyers around the 200 SMA. Having established a daily low at 1.0800, a break through the level should lead to a downward continuation, with the immediate support at 1.0760, followed then by 1.0710, 23.6% retracement of the same rally. Above 1.0865 the pair can advance up to 1.0900, and above towards 1.0950, with sellers probably surging around this last.
Support levels: 1.0800 1.0760 1.0710
Resistance levels: 1.0865 1.0900 1.0950
GBP/USD Current price: 1.4889
View Live Chart for the GBP/USD

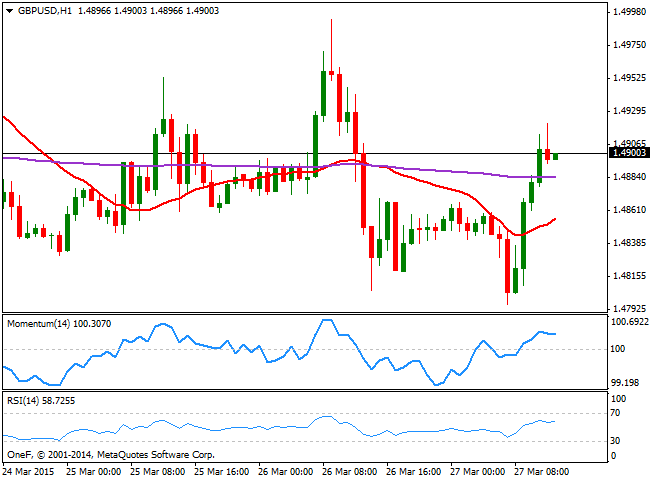
The GBP/USD pair recovered from a fresh weekly low of 1.4796, up to the 1.4900 area, consolidating around it after US GDP final Q4 reading printed 2.2%. The 1 hour chart shows that the price extended above its 20 SMA that now aims slightly higher around 1.4840, whilst the technical indicators are losing their upward strength, but holding in positive territory. In the 4 hours chart the pair maintains a mild negative tone, as the price moves back and forth around a bearish 20 SMA, whilst the technical indicators turned lower below their midlines. The pair has an immediate resistance level at 1.4920, with a break above it exposing 1.4950. Above this last, the pair may attempt to retest the 1.5000 level, but selling interest around it has been quite strong lately, limiting chances of further advances. Below 1.4870 on the other hand, the pair may likely resume the downside, eyeing then a retest of the daily low.
Support levels: 1.4870 1.4840 1.4800
Resistance levels: 1.4920 1.4950 1.5000
USD/JPY Current price: 119.14
View Live Chart for the USD/JPY
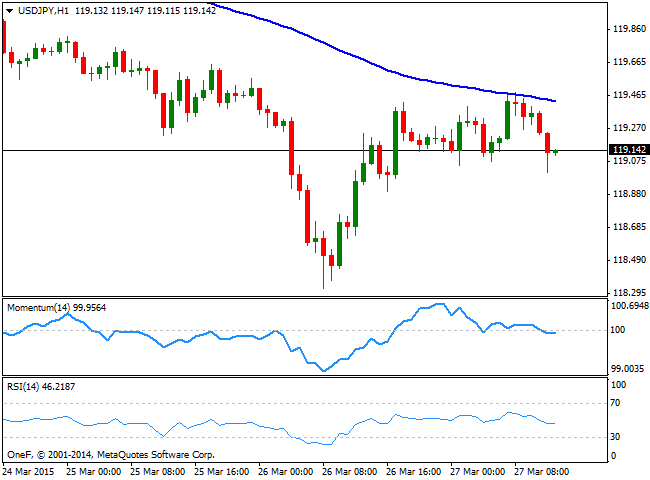
The USD/JPY remained capped below the 119.65 price zone, a strong static resistance level, maintaining an overall negative tone in the short term. The 1 hour chart shows that the price retraces from its 100 SMA that maintains a strong bearish slope around 119.40, whilst the technical indicators are crossing their midlines to the downside, supporting additional short term declines. In the 4 hours chart indicators are now turning south well below their midlines after correcting oversold levels, supporting the shorter term view. The pair will get some relief only with a steady recovery above the 120.00 level, whilst the bearish potential will likely resume on a break below the 118.70 support.
Support levels: 119.05 118.70 118.30
Resistance levels: 119.65 120.00 120.40
AUD/USD Current price: 0.7796
View Live Chart for the AUD/USD
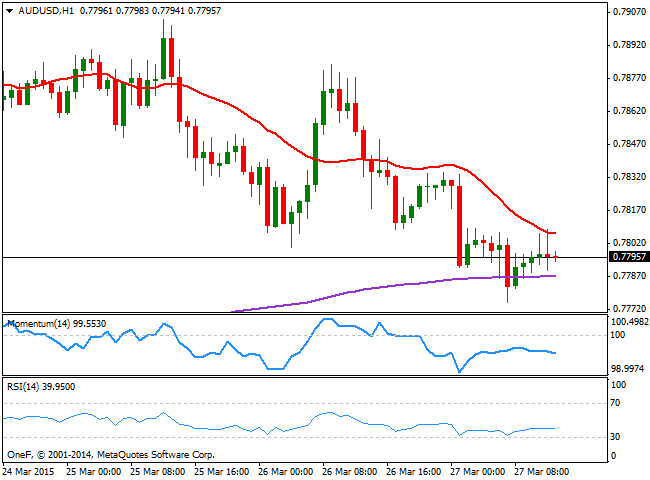
The AUD/USD pair trades lower in range this Friday, having found short term buyers around the 0.7770 area. The dominant bearish trend seems ready to resume, as the 1 hour chart shows that the price develops below a bearish 20 SMA, whilst the indicators gain tepid bearish slopes below their midlines. In the 4 hours chart the price holds above its 200 EMA a key midterm dynamic support, but stands below a bearish 20 SMA now around 0.7850, whilst the technical indicators head lower below their midlines. A downward acceleration below 0.7770 is required to confirm further intraday declines, whilst selling interest will likely surge on approaches to the 0.7880/0.7900 price zone, once the dust settles.
Support levels: 0.7800 0.7770 0.7725
Resistance levels: 0.7810 0.7850 0.7890
Recommended Content
Editors’ Picks
EUR/USD clings to gains above 1.0750 after US data

EUR/USD manages to hold in positive territory above 1.0750 despite retreating from the fresh multi-week high it set above 1.0800 earlier in the day. The US Dollar struggles to find demand following the weaker-than-expected NFP data.
GBP/USD declines below 1.2550 following NFP-inspired upsurge

GBP/USD struggles to preserve its bullish momentum and trades below 1.2550 in the American session. Earlier in the day, the disappointing April jobs report from the US triggered a USD selloff and allowed the pair to reach multi-week highs above 1.2600.
Gold struggles to hold above $2,300 despite falling US yields

Gold stays on the back foot below $2,300 in the American session on Friday. The benchmark 10-year US Treasury bond yield stays in negative territory below 4.6% after weak US data but the improving risk mood doesn't allow XAU/USD to gain traction.
Bitcoin Weekly Forecast: Should you buy BTC here? Premium

Bitcoin (BTC) price shows signs of a potential reversal but lacks confirmation, which has divided the investor community into two – those who are buying the dips and those who are expecting a further correction.
Week ahead – BoE and RBA decisions headline a calm week

Bank of England meets on Thursday, unlikely to signal rate cuts. Reserve Bank of Australia could maintain a higher-for-longer stance. Elsewhere, Bank of Japan releases summary of opinions.