EUR/USD Current price: 1.2549
View Live Chart for the EUR/USD
The EUR/USD pair has once again, failed to define a clear direction this Thursday, despite the notorious imbalance between both economies: earlier on the day, European data shown Manufacturing and Services PMIs in the region fell back particularly in Germany and the EU after last month recovery. In the US on the other hand, inflation rose to 1.7% yearly basis, existing home sales ticked higher, Philadelphia manufacturing survey post it’s highest since 1993, and only weekly unemployment rates missed expectations by printing 291K. However, the dollar was unable to rally on good news, a red flag for buyers.
Technically, the 1 hour chat shows pretty choppy price action within range, with price now above its moving averages, as indicators move back and forth around their midlines, clueless. In the 4 hours chart indicators lack strength but hold above their midlines, while 20 SMA aims higher acting as intraday support now around 1.2525. A higher high of 1.2599 daily basis, suggest some further attempts from buyers are likely albeit sellers won’t give up unless 1.2620 is finally taken, at least in the short term.
Support levels: 1.2525 1.2490 1.2450
Resistance levels: 1.2620 1.2660 1.2700
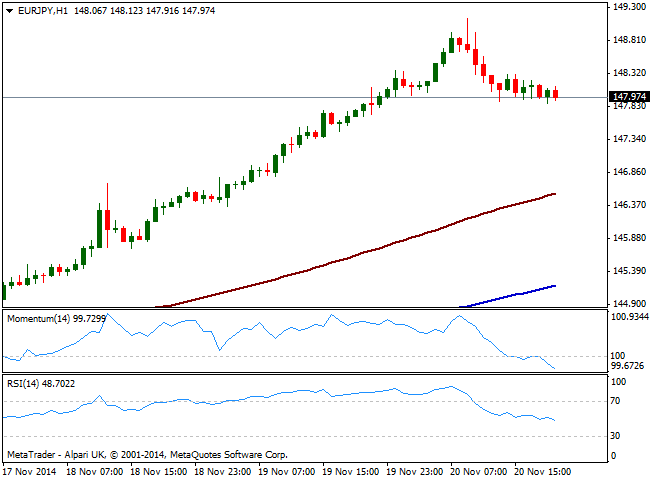
EUR/JPY Current price: 147.97
View Live Chart for the EUR/JPY

Yen continued falling against its rivals in Thursday Asian session, reaching fresh multi-year lows against most of them and sending EUR/JPY up to 149.13. Nevertheless, the pair retraced slowly but steadily from there, finally finding short term buying interest around the 148.00 figure where it stands. Yen’s downward movement may have been too much too fast, and the daily candle, looking like an inverted hammer, may be the first clue of some corrective movement coming ahead. Short term, the 1 hour chart shows price developing well above 100 and 200 SMAs, both with a healthy bullish slope, albeit indicators turned lower, now entering negative territory. In the 4 hours chart momentum turned south still well above its midline, while RSI stands flat at 68, giving room for a deeper corrective movement if initial support at 147.70 gives up.
Support levels: 147.70 147.24 136.90
Resistance levels: 148.20 148.60 149.00
GBP/USD Current price: 1.5707
View Live Chart for the GBP/USD
Cable posted its second day in a row of gains, stalling however around critical resistance, the 1.5740 price zone: the level stands as the neckline of a double floor established around 1.5585. From the data front, UK Retail Sales resulted well above expected, helping the local currency recover ground against an unattractive greenback. Technically, the 1 hour chart shows price above its 20 SMA and indicators aiming higher after bouncing from their midlines, keeping the short term upward tone alive. In the 4 hours chart however, the picture is much less attractive: 20 SMA stands flat providing intraday short term support around 1.5655, whilst indicators barely aim higher above their midlines, neutral for the most. Some follow through above afore mentioned resistance of 1.5740 should see a quick advance towards 1.5770 a strong long term resistance area. If above this last, sellers will likely retreat, at least temporally, letting the pair run above the 1.5800 figure.
Support levels: 1.5655 1.5610 1.5585
Resistance levels: 1.5740 1.5770 1.5815
USD/JPY Current price: 117.82
View Live Chart for the USD/JPY
Another day, another figure: the USD/JPY flirted with the 119.00 level early Asia, despite local share markets failed to post higher highs, with Nikkei posting a shy 0.07% advance before the close. Some profit taking and dollar dumping favored latest decline in the pair that posted an intraday low of 117.74. Now struggling to regain the 118.00 mark, the 1 hour chart shows indicators with a strong bearish momentum deep into negative territory, whist 100 and 200 SMAs head strongly up well below current price, the shortest in fact around 117.10. In the 4 hours chart momentum regains the upside after a limited correction in positive territory, while RSI signals a possible downward correction, reentering from overbought territory now at 63. Considering the pair added over 1000 pips ever since the BOJ announced a surprise round of stimulus past October 31st, risk of a stronger downward corrective movement has increased exponentially, moreover on a break below afore mentioned 117.10 level, now the line in the sand for a bearish breakout.
Support levels: 117.80 117.45 117.10
Resistance levels: 118.20 118.60 119.00
AUD/USD Current price: 0.8634
View Live Chart of the AUD/USD
The AUD/USD decline extended to 0.8565 daily basis, with the pair finally recovering the ground lost over Asian hours and closing in the green. News that Chinese manufacturing output contracted for first time in six months last November down to 49.5, weighted on Aussie, but once again, it was the lack of dollar demand during the last two sessions what helped the pair recover some ground. Daily basis, the picture is still strongly bearish, albeit shorter time frames suggest the pair may extend current recovery during the upcoming hours: the 1 hour chart shows price above its 20 SMA and indicators heading strongly up above their midlines. In the 4 hours chart 20 SMA caps the upside around 0.8670 becoming the level to overcome to see a firmer recovery, whist indicators bounce from oversold level still deep in the red. A drop back below the 0.0.8590 will deny chances of such upward continuation, favoring a quick slide towards 0.8550 in route to 0.8505 price zone.
Support levels: 0.8590 0.8550 0.8505
Resistance levels: 0.8660 0.8700 0.8740
Recommended Content
Editors’ Picks
AUD/USD: Further losses retarget the 200-day SMA

Further gains in the greenback and a bearish performance of the commodity complex bolstered the continuation of the selling pressure in AUD/USD, which this time revisited three-day lows near 0.6560.
EUR/USD: Further weakness remains on the cards

EUR/USD added to Tuesday’s pullback and retested the 1.0730 region on the back of the persistent recovery in the Greenback, always against the backdrop of the resurgence of the Fed-ECB monetary policy divergence.
Gold flirts with $2,320 as USD demand losses steam

Gold struggles to make a decisive move in either direction and moves sideways in a narrow channel above $2,300. The benchmark 10-year US Treasury bond yield clings to modest gains near 4.5% and limits XAU/USD's upside.
Bitcoin price dips to $61K range, encourages buying spree among BTC fish, dolphins and sharks

Bitcoin (BTC) price is chopping downwards on the one-day time frame, while the outlook seen in the one-week period is a horizontal trade. In this shakeout moment, data shows that large holders are using the correction to buy up BTC.
Navigating the future of precious metals

In a recent episode of the Vancouver Resource Investment Conference podcast, hosted by Jesse Day, guests Stefan Gleason and JP Cortez shared their expert analysis on the dynamics of the gold and silver markets and discussed legislative efforts to promote these metals as sound money in the United States.