EUR/USD Current price: 1.2608
View Live Chart for the EUR/USD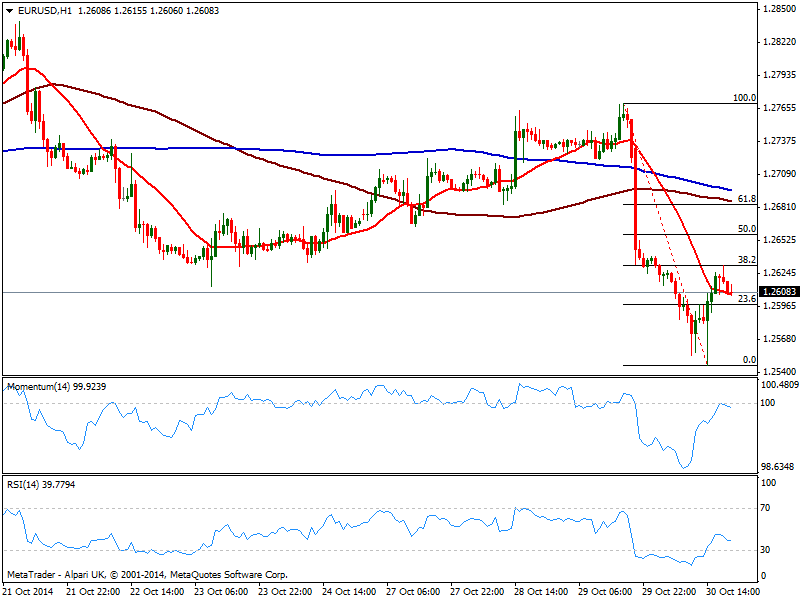
Dollar closes Thursday mixed, in another quite active journey for investors: early US session, local GDP data quick started a dollar rally with a strong 3.5% headline. But majors quickly changed direction amid some worrisome subcomponents: government spending climbed at 4.6% the most since mid 2009, while the trade gap narrowed just a bit, from $460.4 billion to $409.9 billion, as imports dropped reflecting less consumption amid global slowdown. On Friday, the EZ will release its CPI the last strong reading of the month: EUR can find some support if inflation ticks higher, and attempt to extend current upward correction towards 1.2680.
The EUR/USD printed a low of 1.2546 before recovering up to 1.2631, the 38.2% retracement of these two days bearish run. Retracing from the level, the 1 hour chart shows price hovering around its 20 SMA, while indicators erased all of their extreme oversold readings, but failed to overcome their midlines, keeping the risk to the downside. In the 4 hours chart 20 SMA also presents a bearish slope, converging with the 61.8% retracement of the same bearish run around 1.2680, while indicators remain well below their midlines. Renewed selling interest below 1.2580 should see the pair resuming the downside, eyeing a probable retest of the 1.2501 year low.
Support levels: 1.2580 1.2550 1.2500
Resistance levels: 1.2630 1.2660 1.2700
EUR/JPY Current price: 137.85
View Live Chart for the EUR/JPY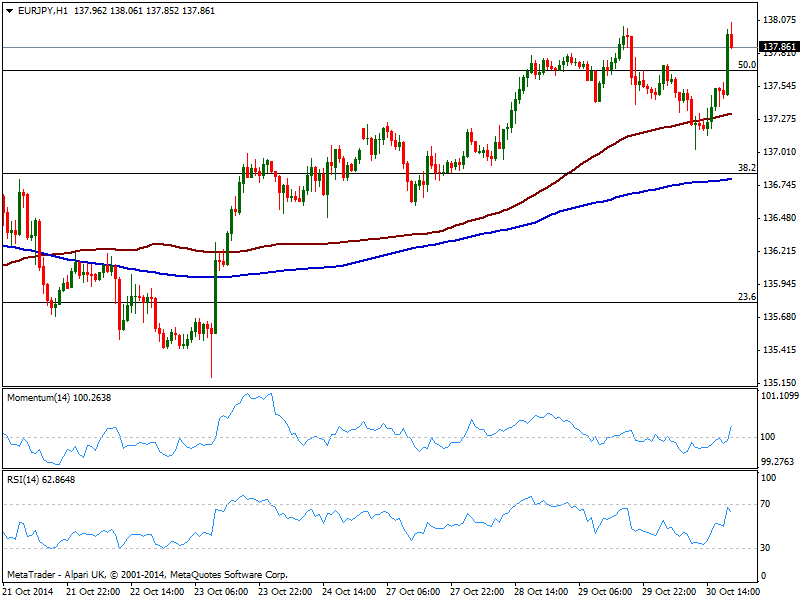
Yen stands as the biggest loser of the day, hit by a strong rally in US stocks, as DJIA is up over 180 points and S&P nears 1900, and a revival of a news that has been hitting wires for a couple weeks already: Japan's Government Pension Investment Fund, the world's largest public pension fund, is working out plans to increase its portfolio allocation devoted to domestic stocks to around 25%, meaning buying a whopping 8 trillion yen in Japanese shares. The EUR/JPY trades near a fresh weekly high set at 138.06, with the 1 hour chart showing momentum heading higher above 100 and RSI nearing 70, as 100 SMA offers intraday support around 137.30. In the 4 hours chart momentum bounced from 100 and maintains an upward slope, while RSI stands directionless around 60: critical resistance stands at 138.50, 61.8% retracement of the latest daily fall, and it will take a break above it to see the pair extending its advance.
Support levels: 137.30 136.80 136.40
Resistance levels: 137.70 138.50 138.85
GBP/USD Current price: 1.6004
View Live Chart for the GBP/USD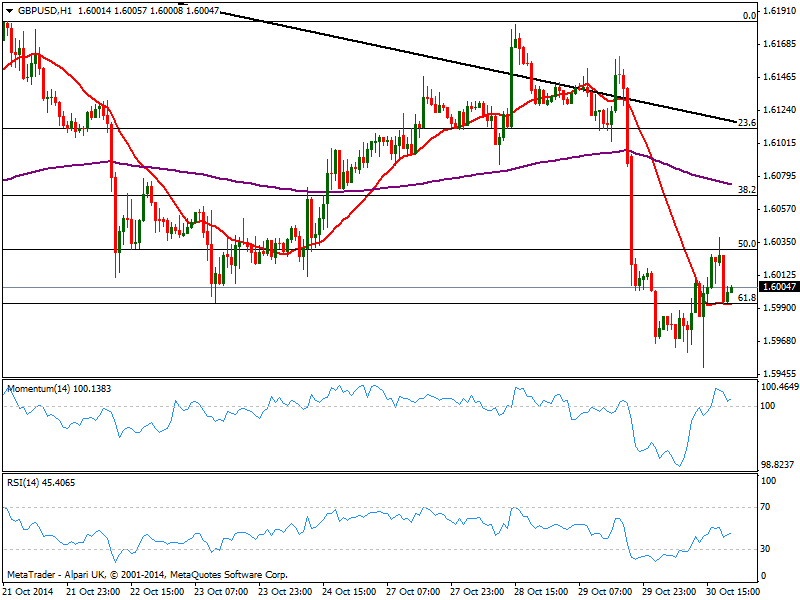
The GBP/USD also seized the day to correct higher, advancing up to 1.6038 after putting a fresh weekly low of 1.5950. Short term, the 1 hour chart shows 20 SMA flat around 1.5995 also the 61.8% retracement of the latest bullish run, while indicators aim higher above their midlines. In the 4 hours chart however, 20 SMA maintains a strong bearish slope above current price, while indicators barely corrected oversold readings and hold well into red. A price acceleration below 1.5995 should see the bearish momentum increase, and favor a run towards 1.5950, while if below there’s little in the way down to 1.5874 this month low. New advances above 1.6035 on the other hand should see the pair extending up to 1.6060 in the short term, and near 1.6100 if this last gives up.
Support levels: 1.5995 1.5950 1.5910
Resistance levels: 1.6035 1.6060 1.6090
USD/JPY Current price: 109.31
View Live Chart for the USD/JPY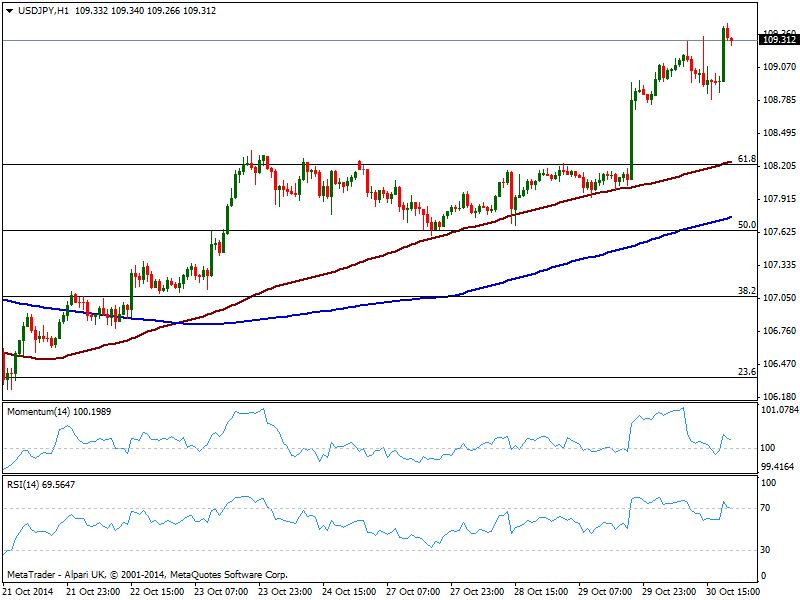
The USD/JPY took one more step towards a retest of the 110.00 level, trading at its highest in 3 weeks. The 1 hour chart shows some bearish divergences coming from momentum indicator, as price posts higher highs while the indicators post lower ones, but as long as above 100, risk to the downside seems limited. RSI in the same time frame retraces some from overbought readings, currently at 68, while 100 SMA offers ultimate support in the 108.20/30 price zone. Furthermore, Nikkei points for a strong opening, which should also favor the upside in the pair. As for the 4 hours chart indicators continue to head higher despite in overbought territory, supporting the shorter term view.
Support levels: 108.70 108.25 107.70
Resistance levels: 109.45 109.90 110.20
AUD/USD Current price: 0.8831
View Live Chart of the AUD/USD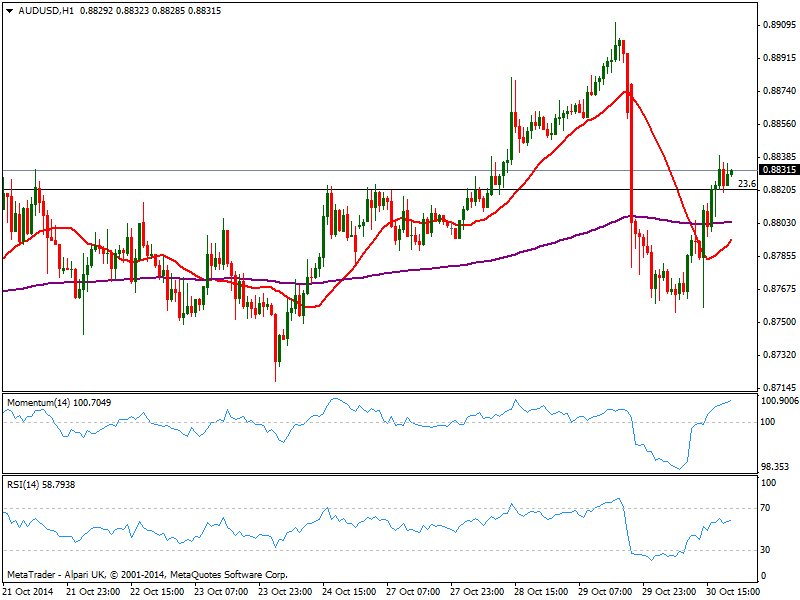
Australian dollar regained the 0.8820 level against the greenback after finding buyers in the 0.8755 price zone. Latest price developments suggest some carry trade going on in the pair, and the break again above 0.8820 supports some continued advances at least in the short term. Technically, the 1 hour chart shows 20 SMA gaining a strong bullish slope well below current price, while indicators maintain the bullish bias. In the 4 hours chart a mild positive tone is present with price above a flat 20 SMA and indicators aiming higher above their midlines.
Support levels: 0.8820 0.8770 0.8730
Resistance levels: 0.8850 0.8890 0.8930
Recommended Content
Editors’ Picks
EUR/USD clings to gains above 1.0750 after US data

EUR/USD manages to hold in positive territory above 1.0750 despite retreating from the fresh multi-week high it set above 1.0800 earlier in the day. The US Dollar struggles to find demand following the weaker-than-expected NFP data.
GBP/USD declines below 1.2550 following NFP-inspired upsurge

GBP/USD struggles to preserve its bullish momentum and trades below 1.2550 in the American session. Earlier in the day, the disappointing April jobs report from the US triggered a USD selloff and allowed the pair to reach multi-week highs above 1.2600.
Gold struggles to hold above $2,300 despite falling US yields

Gold stays on the back foot below $2,300 in the American session on Friday. The benchmark 10-year US Treasury bond yield stays in negative territory below 4.6% after weak US data but the improving risk mood doesn't allow XAU/USD to gain traction.
Bitcoin Weekly Forecast: Should you buy BTC here? Premium

Bitcoin (BTC) price shows signs of a potential reversal but lacks confirmation, which has divided the investor community into two – those who are buying the dips and those who are expecting a further correction.
Week ahead – BoE and RBA decisions headline a calm week

Bank of England meets on Thursday, unlikely to signal rate cuts. Reserve Bank of Australia could maintain a higher-for-longer stance. Elsewhere, Bank of Japan releases summary of opinions.