EUR/USD Current price: 1.2805
View Live Chart for the EUR/USD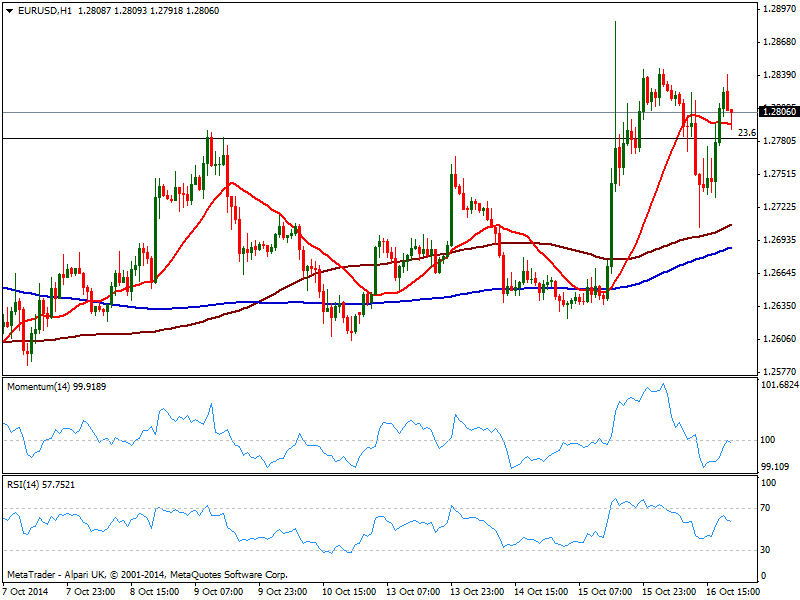
Roller-coaster trading extended into Thursday, with price action clearly reflecting latest developments got to investors’ nerves. European stocks opened with a positive tone, but sunk ahead of US opening with US indexes also diving early American session. Dollar attempted a came back after the release of positive US data, regarding employment and manufacturing, but after over a week of steady declines, greed overlapped fear: stocks become cheap and charming, and US indexes bounced strongly up to close pretty much unchanged from Wednesday close.
In the EUR/USD, a deep to 1.2700 was also seen as a buying opportunity, with the pair surging back above the 1.2800 figure where it stands early Asian session. The 1 hour chart shows price struggling above a flat 20 SMA and indicators losing upward potential around their midlines, yet the 4 hours chart maintains a strong upward momentum, suggesting the rally may finally extend through 1.2845 immediate resistance.
Support levels: 1.2790 1.2740 1.2700
Resistance levels: 1.2845 1.2890 1.2930
EUR/JPY Current price: 135.86
View Live Chart for the EUR/JPY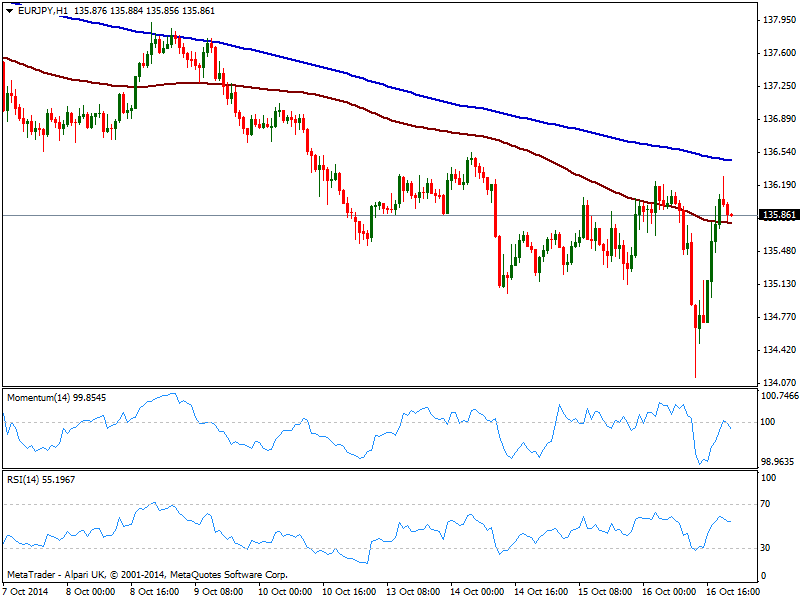
The EUR/JPY recovered strongly from a fresh year low of 134.13 but remains unable to firmly establish above the 136.00 mark. Trading a few pips below the daily opening, the daily candle shows a lower low and a higher high, and considering how attached yen has been to stocks lately, if the recovery in indexes extends into Asia, chances are to the upside. Short term, the 1 hour chart shows price above 100 SMA but indicators retracing from their midlines, not yet confirming further advances. In the 4 hours chart technical readings present a clear upward momentum, to be confirmed with some steady advance beyond 136.00/20 price zone.
Support levels: 135.50 134.90 134.50
Resistance levels: 135.90 136.20 136.70
GBP/USD Current price: 1.6070
View Live Chart for the GBP/USD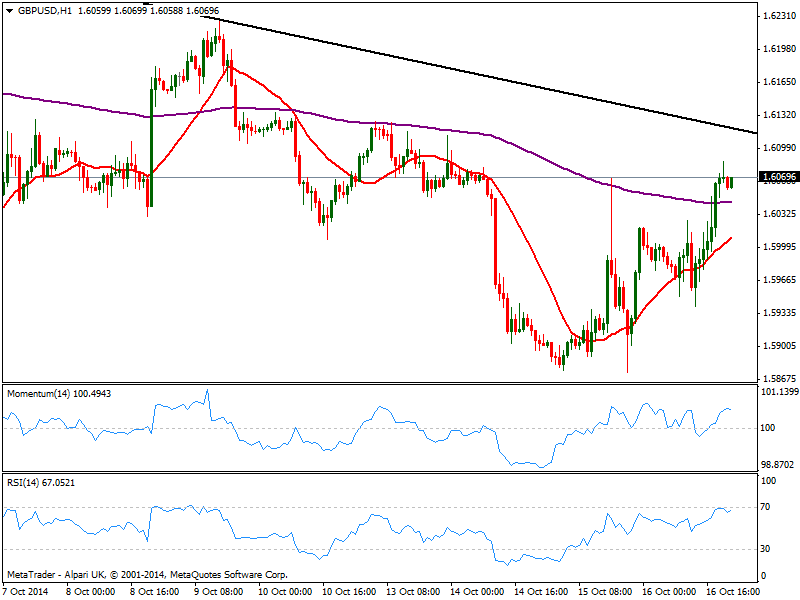
The GBP/USD pressures the 1.6100 figure late US afternoon, with the 1 hour chart showing indicators easing near overbought territory, but 20 SMA maintaining a strong upward slope, and considering price behavior, seems further advances will follow. In the 4 hours chart technical readings present a strong upward tone also, but 20 SMA however maintains a mild bearish slope below current price, not yet aiming to turn higher. Critical level stands now at 1.6110/20 price zone, a daily descendant trend line coming from 1.6253: a break above it should confirm the upward continuation, while 1.6060 now is the short term line in the sand towards the downside.
Support levels: 1.606 1.6020 1.5970
Resistance levels: 1.6115 1.6150 1.6190
USD/JPY Current price: 106.22
View Live Chart for the USD/JPY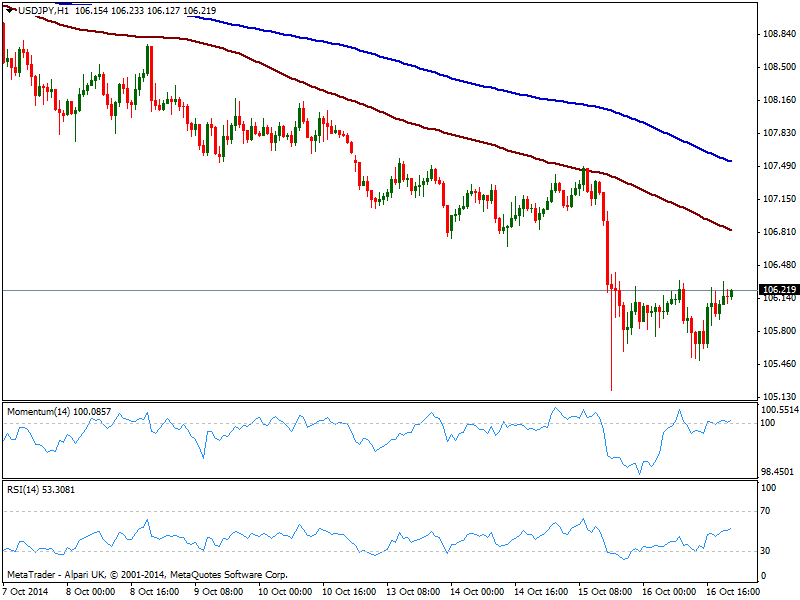
The USD/JPY presents limited intraday gains this Thursday, trading near 106.30 resistance and having post a higher low daily basis, of 105.50. The 1 hour chart shows indicators mostly neutral and with a quite limited upward slope, while 100 and 200 SMAs maintain a strong bearish slope well above current price, with the shorter offering dynamic resistance now around 106.80. In the 4 hours chart indicators aim higher from overbought territory while moving averages stand way above current price. An advance above 106.30 should signal some short term gains towards 106.70/80 price zone, but it will take the pair to regain this last to confirm a firmer upward pace.
Support levels: 105.90 105.50 105.10
Resistance levels: 106.30 106.70 107.10
AUD/USD Current price: 0.8764
View Live Chart of the AUD/USD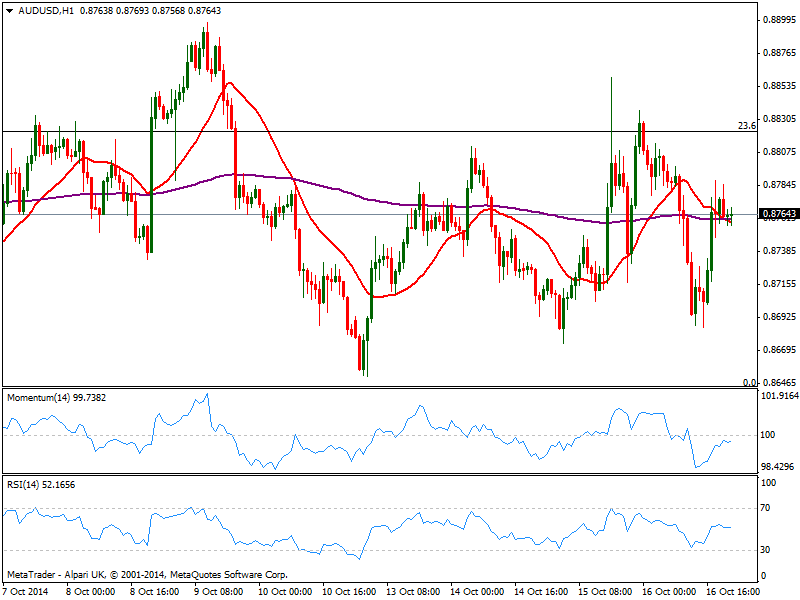
The AUD/USD remains within range daily basis, finding short term sellers in the 0.8800 level. The 1 hour chart shows a mild bearish tone as per price pressuring a bearish to20 SMA from above, and indicators turning lower below their midlines. In the 4 hours chart technical indicators aim higher around their midlines, while price continues to move back and forth around a flat 20 SMA. As commented on previous updates, the pair will remain neutral until either 0.8820 or 0.8640 finally gives up.
Support levels: 0.8730 0.8690 0.8640
Resistance levels: 0.8770 0.8820 0.8860
Recommended Content
Editors’ Picks
EUR/USD clings to gains above 1.0750 after US data

EUR/USD manages to hold in positive territory above 1.0750 despite retreating from the fresh multi-week high it set above 1.0800 earlier in the day. The US Dollar struggles to find demand following the weaker-than-expected NFP data.
GBP/USD declines below 1.2550 following NFP-inspired upsurge

GBP/USD struggles to preserve its bullish momentum and trades below 1.2550 in the American session. Earlier in the day, the disappointing April jobs report from the US triggered a USD selloff and allowed the pair to reach multi-week highs above 1.2600.
Gold struggles to hold above $2,300 despite falling US yields

Gold stays on the back foot below $2,300 in the American session on Friday. The benchmark 10-year US Treasury bond yield stays in negative territory below 4.6% after weak US data but the improving risk mood doesn't allow XAU/USD to gain traction.
Bitcoin Weekly Forecast: Should you buy BTC here? Premium

Bitcoin (BTC) price shows signs of a potential reversal but lacks confirmation, which has divided the investor community into two – those who are buying the dips and those who are expecting a further correction.
Week ahead – BoE and RBA decisions headline a calm week

Bank of England meets on Thursday, unlikely to signal rate cuts. Reserve Bank of Australia could maintain a higher-for-longer stance. Elsewhere, Bank of Japan releases summary of opinions.