EUR/USD Current price: 1.2951
View Live Chart for the EUR/USD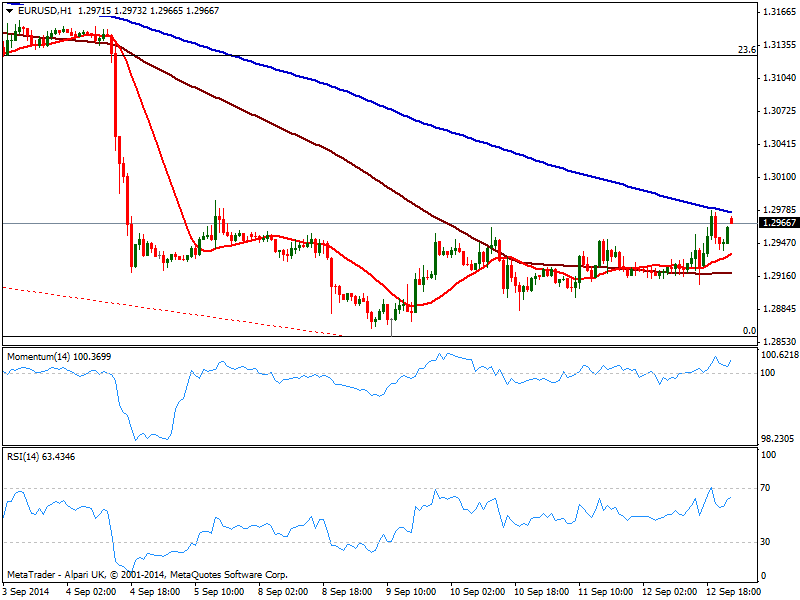
Dollar opens the week lower across the board, exception made by Aussie, weighted by weak Chinese data released over the weekend. The EUR/USD managed to advance some above the 1.2950 late US session on Friday, as the greenback eased on falling local share markets; futures opened also a tad lower keeping the pair above the level which stands now as immediate short term support. The calendar for the week includes inflationary readings for both economies, FED meeting and the Scottish referendum, anticipating some nice triggers from that side.
Technically, the EUR/USD 1 hour chart shows price stalled around a bearish 200 SMA while price advances above a bullish 20 SMA and indicators grind higher above their midlines. In the 4 hours chart technical readings also head higher in positive territory, supporting some upward potential as long as mentioned support holds. Immediate resistance stands at 1.2990, post US NFP high, followed by a stronger one in the 1.3040/50 price zone.
Support levels: 1.2950 1.2920 1.2880
Resistance levels: 1.3000 1.3045 1.3080
EUR/JPY Current price: 139.08
View Live Chart for the EUR/JPY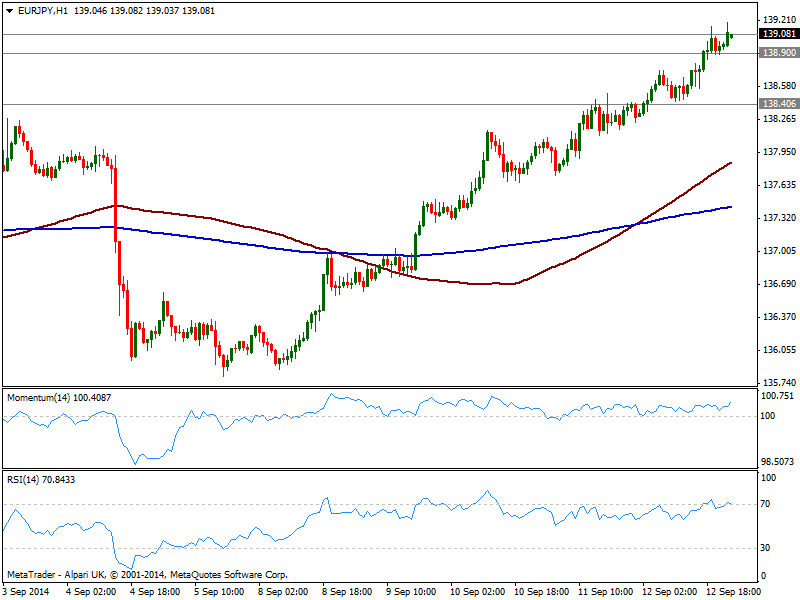
The EUR/JPY holds above 138.90 maintaining its steady advance after bottoming around 135.70 earlier this month. Yen weakness seems far from easing and Chinese data also weights on yen despite not as much as in Aussie. The EUR/JPY hourly chart shows 100 SMA advancing firmly above 200 one both well below current price as momentum aims higher above its midline. RSI in the same time frame stands in overbought territory, but there is no sign the pair may attempt to correct lower. In the 4 hours chart technical readings present a strong upward tone, with RSI also in overbought territory: there are some former intraday highs around 139.20/30 offering immediate resistance, with some steady gains above it anticipating a probable approach to 140.00 price zone. Critical support stands at 138.40 and a break below should see the pair turning back south over the upcoming days.
Support levels: 138.90 138.40 138.00
Resistance levels: 139.30 139.70 140.10
GBP/USD Current price: 1.6268
View Live Chart for the GBP/USD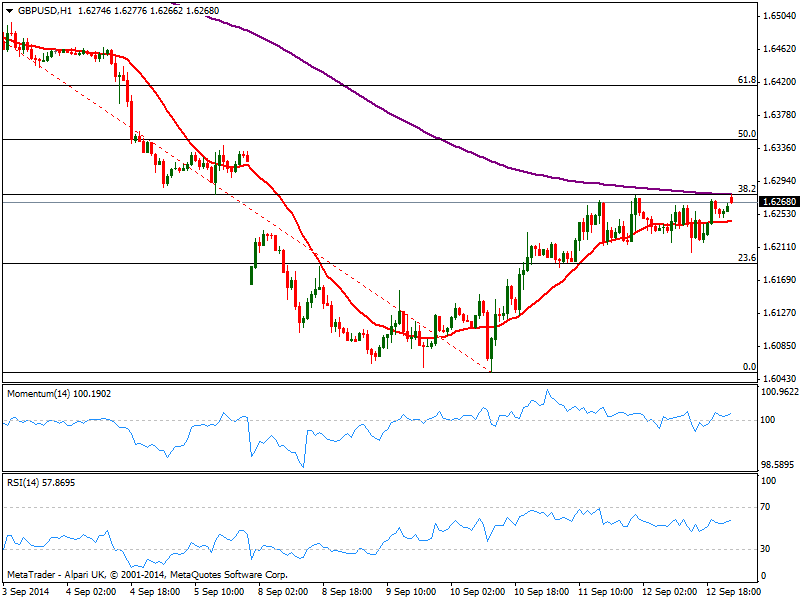
Despite a small gap higher, the GBP/USD remains below critical resistance around 1.6280, 38.2% retracement of its latest daily fall, maintaining a short term neutral technical stance. During the upcoming days, the UK will release two key macro readings, employment and inflation. But with the Scottish referendum on Thursday, market will be paying more attention to polls and reacting strongly to them, not to mention some choppy trading is expected until then. In the short term, the 1 hour chart shows a quite neutral stance with indicators flat above their midlines and 20 SMA horizontal, while the 4 hours chart shows price standing above a bullish 20 SMA but indicators look exhausted to the upside, now turning lower still in positive territory.
Support levels: 1.6190 1.6150 1.6115
Resistance levels: 1.6280 1.6320 1.6350
USD/JPY Current price: 107.26
View Live Chart for the USD/JPY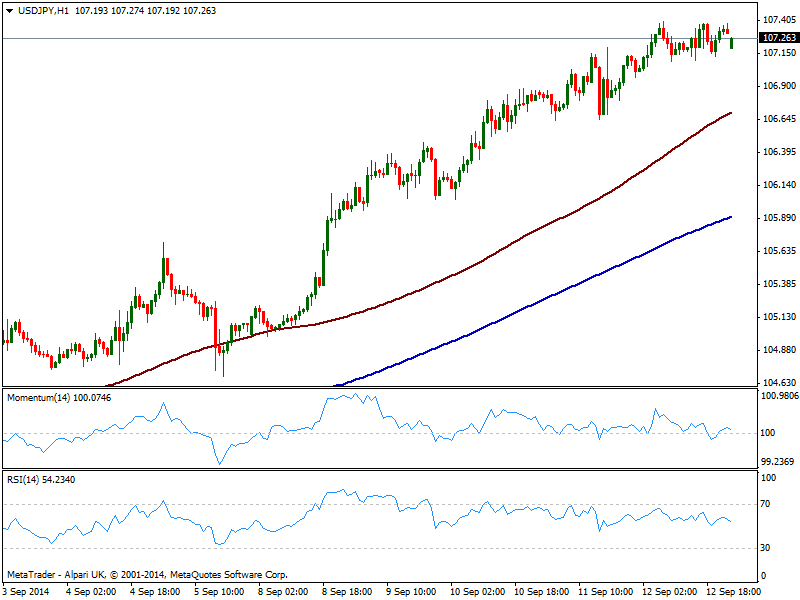
The USD/JPY trades within last Friday range, holding near 107.40 price zone, last Friday high and immediate resistance. The hourly chart presents a mild positive tone, with moving averages still heading higher below current price, 100 SMA now around 106.80 offering short term support, and indicators in positive territory, albeit lacking directional strength. In the 4 hours chart indicators also show no particular bias but hold above their midlines, reflecting current consolidative stage. Some downward correction could not be discarded, yet buyers will likely surge on approaches to mentioned dynamic support.
Support levels: 106.80 106.50 106.10
Resistance levels: 107.40 107.90 108.20
AUD/USD Current price: 0.9013
View Live Chart of the AUD/USD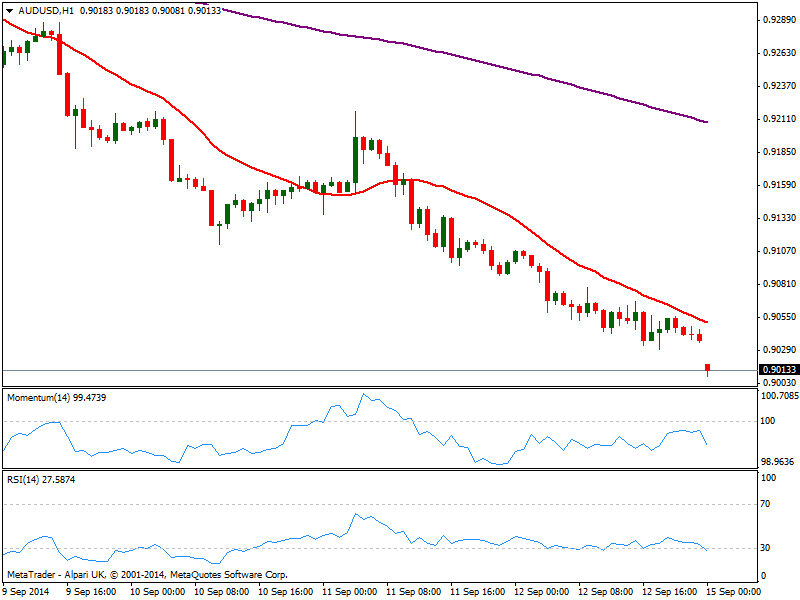
China August factory growth slowed to a new six-year low, dragging AUD/USD near the 0.9000 level, with the pair holding near it an unable to fill the weekly opening gap. The 1 hour chart shows an increasing bearish momentum, with 20 SMA offering dynamic resistance around 0.9040, supporting further slides ahead. In the 4 hours chart indicators are biased lower well into negative territory, which keeps the risk to the downside, moreover on a break below mentioned 0.9000 level.
Support levels: 0.9000 0.8960 0.8920
Resistance levels: 0.9040 0.9070 0.9110
Recommended Content
Editors’ Picks
EUR/USD clings to gains above 1.0750 after US data

EUR/USD manages to hold in positive territory above 1.0750 despite retreating from the fresh multi-week high it set above 1.0800 earlier in the day. The US Dollar struggles to find demand following the weaker-than-expected NFP data.
GBP/USD declines below 1.2550 following NFP-inspired upsurge

GBP/USD struggles to preserve its bullish momentum and trades below 1.2550 in the American session. Earlier in the day, the disappointing April jobs report from the US triggered a USD selloff and allowed the pair to reach multi-week highs above 1.2600.
Gold struggles to hold above $2,300 despite falling US yields

Gold stays on the back foot below $2,300 in the American session on Friday. The benchmark 10-year US Treasury bond yield stays in negative territory below 4.6% after weak US data but the improving risk mood doesn't allow XAU/USD to gain traction.
Bitcoin Weekly Forecast: Should you buy BTC here? Premium

Bitcoin (BTC) price shows signs of a potential reversal but lacks confirmation, which has divided the investor community into two – those who are buying the dips and those who are expecting a further correction.
Week ahead – BoE and RBA decisions headline a calm week

Bank of England meets on Thursday, unlikely to signal rate cuts. Reserve Bank of Australia could maintain a higher-for-longer stance. Elsewhere, Bank of Japan releases summary of opinions.