EUR/USD Current price: 1.3391
View Live Chart for the EUR/USD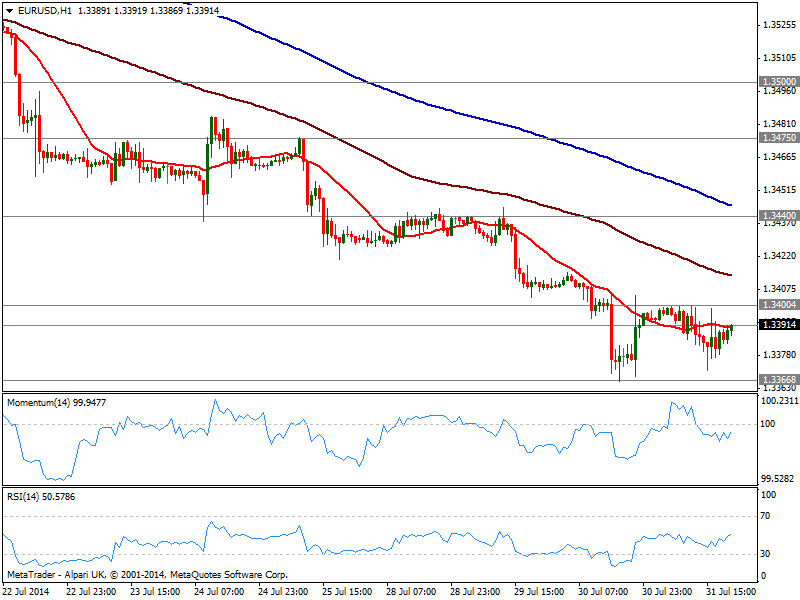
Little may have happened in this consolidative Thursday, but at the end of the day, one thing stands out: Europe is at a brink of deflation with yearly basis inflation ticking down to 0.4% and the ECB at a cross road, condemning the EUR to fall if it acts increasing liquidity, or not acting at all next week. But that’s looking way too ahead, as Friday will bring US employment figure, that an make it or break if for current dollar strength: market is expecting something around 230K in average with the last months, and anything above that should put the dollar in the bullish track; below 200K on the other way, will delay trends’ decissions to ECB meeting next week.
Anyway and from a technical point of view, the EUR/USD spent the day consolidating its latest loses in between 1.3370 and 1.3400. Short term, the hourly chart shows price also below a flat 20 SMA and indicators directionless in negative territory, while the 4 hours chart maintains a bearish tone. Break below 1.3370 on strong US data, may see the pair extending its decline down to 1.3295, November 2013 monthly low.
Support levels: 1.3370 1.3335 1.3295
Resistance levels: 1.3405 1.3440 1.3475
EUR/JPY Current price: 137.71
View Live Chart for the EUR/JPY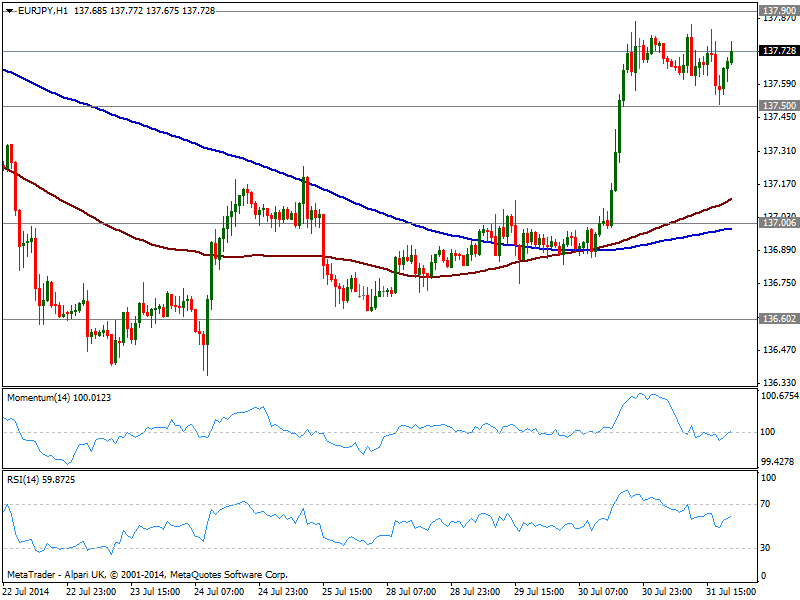
Yen halted its fall against its rivals, in fact resisting pretty well considering US indexes fell sharply on Thursday, erasing all of their monthly gains: weak earnings reports plus worries over Portuguese Espirito Santo bank and Argentinean default weighted in Wall Street. The EUR/JPY closed the day unchanged after finding short term buyers around 137.50, still the immediate support to watch. The short term picture is mild bullish, as price develops well above its 100 and 200 SMAs, with the shortest finally above the larger, albeit indicators hold in neutral territory. In the 4 hours chart however, indicators lost the upward potential and turn south, still above their midlines.
Support levels: 137.50 137.90 136.60
Resistance levels: 137.90 138.40 138.85
GBP/USD Current price: 1.6884
View Live Chart for the GBP/USD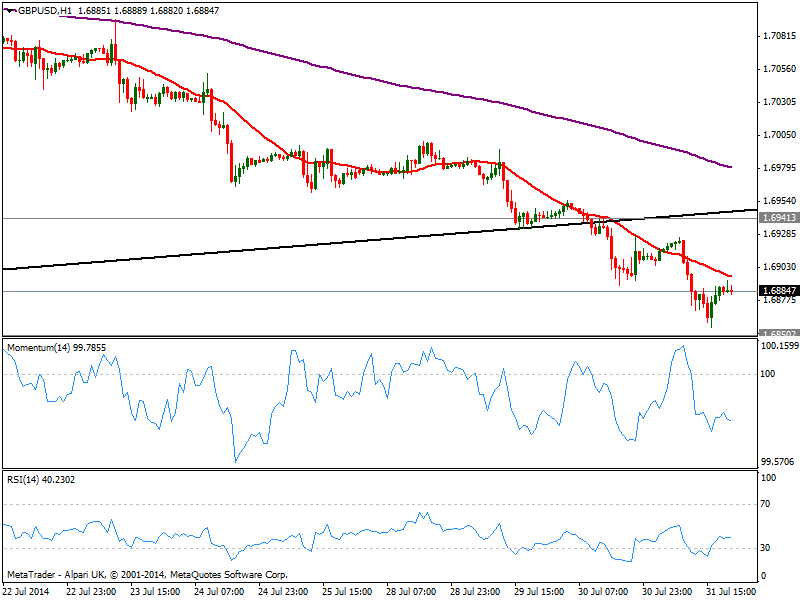
The GBP/USD fell as low as 1.6856 before bouncing, still confined below the 1.6900 figure, and with the hourly chart showing the bearish tone remains intact: 20 SMA caps the upside a few pips above current price, while indicators head south in negative territory. In the 4 hours chart indicators attempt shy bounces from oversold territory, still quite weak and far from suggesting a recovery, while 20 SMA extended its decline and stands in the 1.6950 area acting as dynamic resistance.
Support levels: 1.6850 1.6815 1.6770
Resistance levels: 1.6880 1.6920 1.6950
USD/JPY Current price: 102.79
View Live Chart for the USD/JPY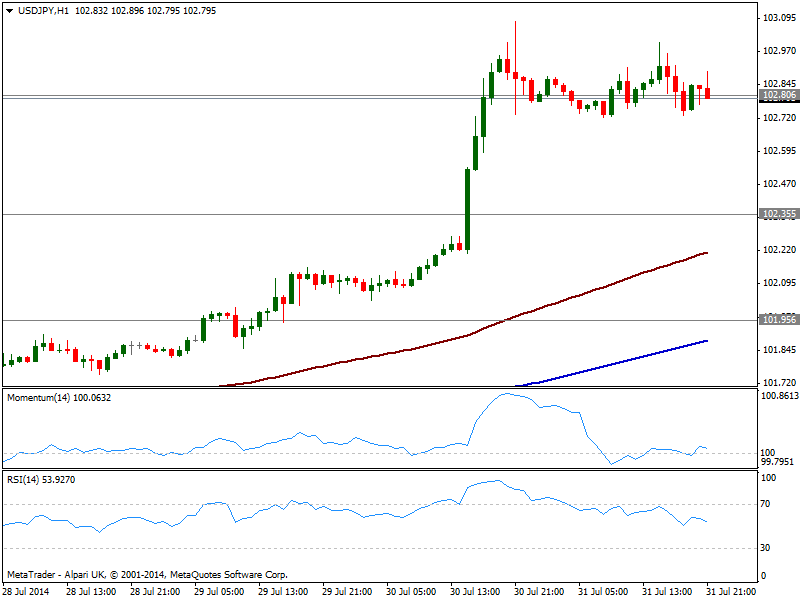
Having failed to extend beyond 103.00, the USD/JPY trades steadily around 102.80 area, coming under pressure not only because stocks in red, but also because US yields, giving up most of yesterday’s gains. The hourly chart however shows price holding in a tight range with moving averages still heading higher below current price, and indicators flat in neutral territory. In the 4 hours chart technical readings ease from overbought territory supporting some downward correction towards 102.35, albeit range will likely prevail ahead of US news, which at the end will be the ones deciding the pair’s destiny.
Support levels: 102.35 101.95 101.60
Resistance levels: 103.10 103.40 103.80
AUD/USD Current price: 0.9291
View Live Chart for the AUD/USD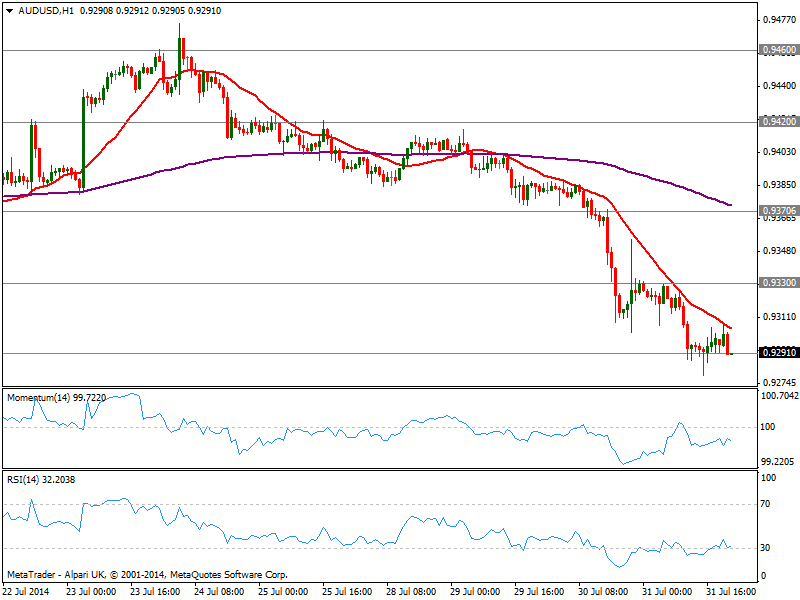
Aussie got hit by local disappointing data, extending its decline to 0.9278 against the greenback, fresh 8-week low. The pair enters Asian session maintaining the short term bearish tone, having been unable to establish back above the 0.9300 level and with the hourly chart showing a clear bearish tone. In the 4 hours chart, indicators are losing their downward potential in oversold levels, but the overall picture is still weak: a break below 0.9260 strong static midterm support, can see the pair extending its decline below the 0.9200 figure before the week is over.
Support levels: 0.9260 0.9220 0.9175
Resistance levels: 0.9300 0.9330 0.9370
Recommended Content
Editors’ Picks
EUR/USD clings to gains above 1.0750 after US data

EUR/USD manages to hold in positive territory above 1.0750 despite retreating from the fresh multi-week high it set above 1.0800 earlier in the day. The US Dollar struggles to find demand following the weaker-than-expected NFP data.
GBP/USD declines below 1.2550 following NFP-inspired upsurge

GBP/USD struggles to preserve its bullish momentum and trades below 1.2550 in the American session. Earlier in the day, the disappointing April jobs report from the US triggered a USD selloff and allowed the pair to reach multi-week highs above 1.2600.
Gold struggles to hold above $2,300 despite falling US yields

Gold stays on the back foot below $2,300 in the American session on Friday. The benchmark 10-year US Treasury bond yield stays in negative territory below 4.6% after weak US data but the improving risk mood doesn't allow XAU/USD to gain traction.
Bitcoin Weekly Forecast: Should you buy BTC here? Premium

Bitcoin (BTC) price shows signs of a potential reversal but lacks confirmation, which has divided the investor community into two – those who are buying the dips and those who are expecting a further correction.
Week ahead – BoE and RBA decisions headline a calm week

Bank of England meets on Thursday, unlikely to signal rate cuts. Reserve Bank of Australia could maintain a higher-for-longer stance. Elsewhere, Bank of Japan releases summary of opinions.