EUR/USD Current price: 1.3521
View Live Chart for the EUR/USD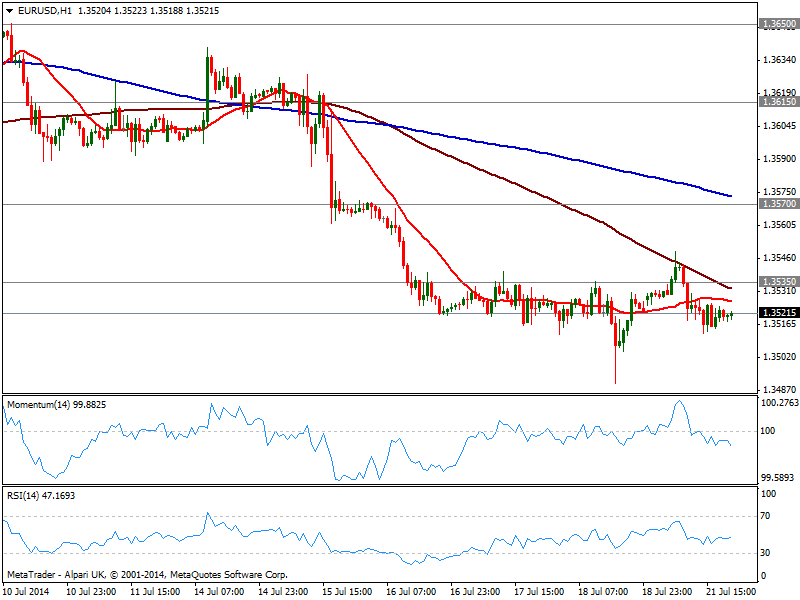
Monday has ended up pretty much as it started across the forex board, with volume reduced to a minimum on summer vacations and no data to drive majors. As for the EUR/USD the pair continued trading at the lower end of its recent range, having posted a short lived intraday spike of 1.3548 and a daily low of 1.3512. Technically the hourly chart shows price developing below moving averages, with 100 one now around 1.3535 static resistance, and reinforcing the strength of the level, as price stands below a flat 20 SMA a few pips below. Indicators in the mentioned time frame head south below their midlines, although lacking strength due to the tight range. In the 4 hours chart a mild bearish tone is also present, yet some follow through below 1.3510 is required to see an extension towards 1.3476 this year low. Recoveries will find strong selling interest on approaches to 1.3570 former support.
Support levels: 1.3510 1.3476 1.3440
Resistance levels: 1.3535 1.3570 1.3620
EUR/JPY Current price: 137.07
View Live Chart for the EUR/JPY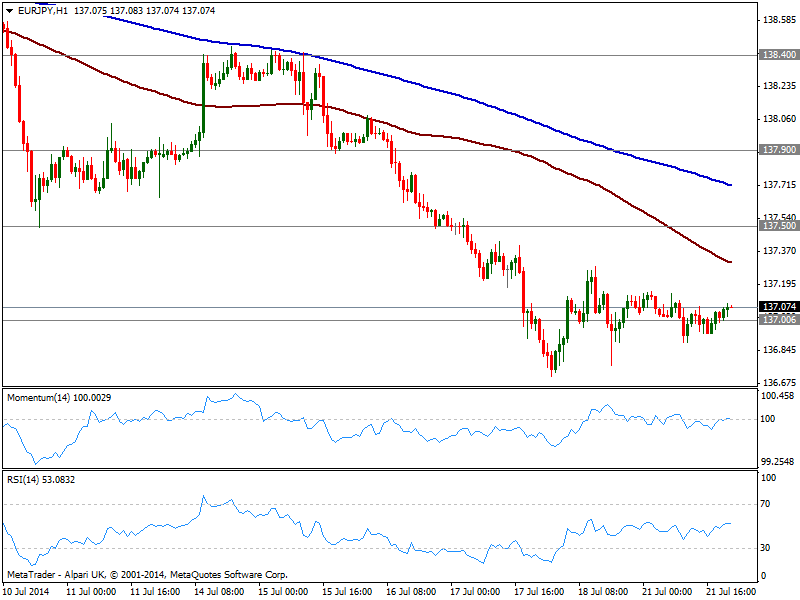
Stocks markets were a bit more entertained over the last session, with European indexes strongly down, and leading to a negative opening in Wall Street that saw DJIA down over 125 points. But American indexes managed to bounce and by the session close trade a few points down, still reflecting the strength of the buying on dips. US Yields also edged lower, with yen finally barely up against its rivals and EUR/JPY struggling around the 137.00 mark. Flat in the short term, the dominant trend is still bearish with price near the 5-month low posted last week at 136.70; the hourly chart shows both 100 and 200 SMA with nice bearish slopes above current price and containing the upside, while the 4 hours chart shows RSI flat right above 30 and momentum retracing from below its midline, all of which keeps the pressure to the downside. Critical support continues to be at 136.60 and if broken, the slide may extend closer to 135.00 before finally halting.
Support levels: 137.00 136.60 136.20
Resistance levels: 137.50 137.90 138.40
GBP/USD Current price: 1.7076
View Live Chart for the GBP/USD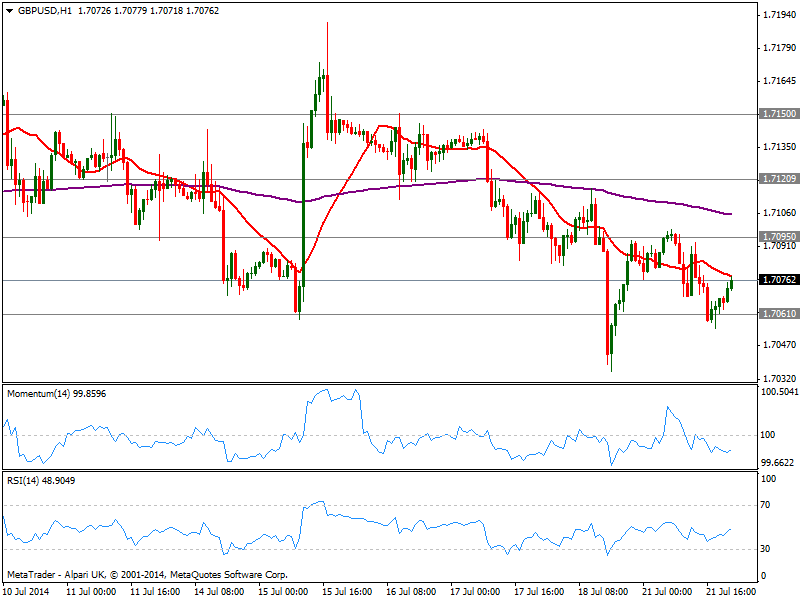
The GBP/USD has traded lower in range, having tested 1.7060 price zone early US session, and with latest bounce capped by a bearish 20 SMA in the hourly chart, while indicators hold below their midlines in the mentioned chart. In the 4 hours chart a mild bearish tone is also present, but the downward pressure seems limited and moreover corrective, as a top at the multi year high of 1.7190 from this week is far from confirmed. In fact, 1.7060 stands for the 23.6% retracement of the latest bullish run, meaning the correction is quite limited. A break below this last may see the pair approaching 1.7000 area, and even then, risk of a reversal will remain limited, with only a daily close below 1.6985 increasing such risk. To the upside, 1.7150 is the critical resistance to watch as if above, the bullish trend will likely resume.
Support levels: 1.7060 1.7025 1.6985
Resistance levels: 1.7095 1.7120 1.7150
USD/JPY Current price: 101.36
View Live Chart for the USD/JPY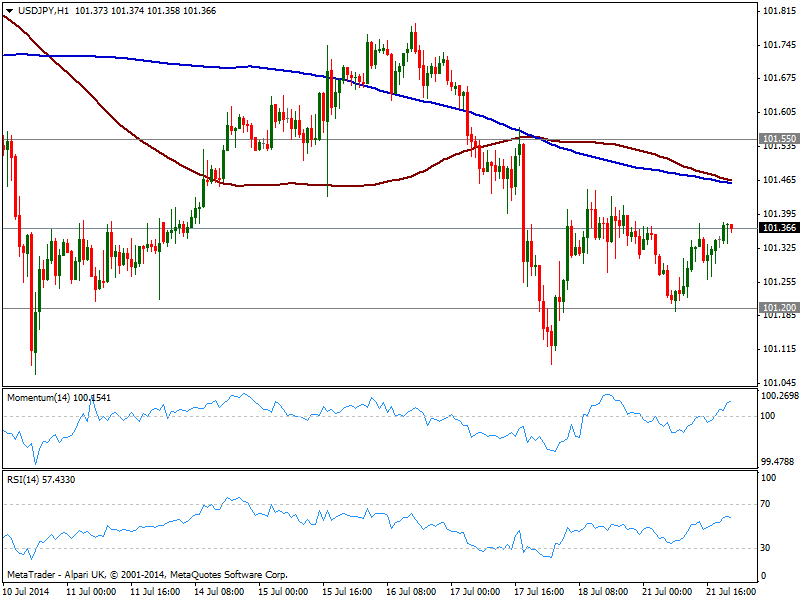
The USD/JPY found short term buyers around 101.20 strong static support area, but remained confined to a tight 20 pips range for most of the day, unchanged from past Asian session opening. The hourly chart shows indicators heading higher above their midlines yet losing upward potential, while 100 and 200 SMA converge around 101.50, acting as dynamic resistance in case of further recoveries. In the 4 hours chart indicators head higher but still in negative territory, while moving averages stand well above current price, all of which limits chances of a strong recovery.
Support levels: 101.20 101.05 100.70
Resistance levels: 101.55 101.95 102.35
AUD/USD Current price: 0.9378
View Live Chart for the AUD/USD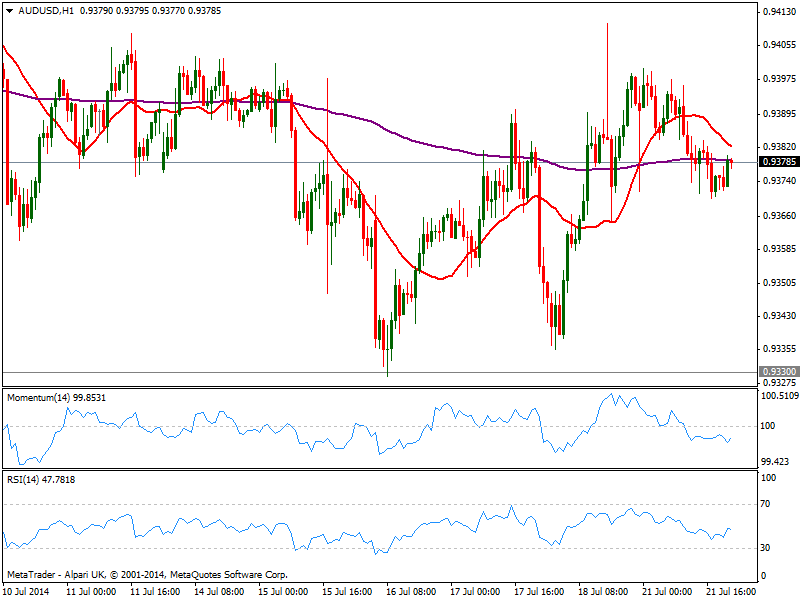
The AUD/USD closed the day a few pips lower, having been rejected after approaching the 0.9400 figure, but holding above 0.9370 static support. The hourly chart presents a slightly bearish tone, as per price below its 20 SMA and indicators in negative territory, albeit directionless. In the 4 hours chart price struggles to hold above its 20 SMA as indicators turned south and approach their midlines, increasing the downside pressure on a break below mentioned support. Nevertheless, the 0.9330 price zone has proved strong over the past 2 months, and it will be only with a break below it that the pair will be exposed to a stronger slide towards 0.9260 long term support.
Support levels: 0.9370 0.9330 0.9300
Resistance levels: 0.9420 0.9460 0.9500
Recommended Content
Editors’ Picks
AUD/USD weakens further as US Treasury yields boost US Dollar

The Australian Dollar extended its losses against the US Dollar for the second straight day, as higher US Treasury bond yields underpinned the Greenback. On Wednesday, the AUD/USD lost 0.26% as market participants turned risk-averse. As the Asian session begins, the pair trades around 0.6577.
EUR/USD stuck near midrange ahead of thin Thursday session

EUR/USD is reverting to the near-term mean, stuck near 1.0750 and stuck firmly in the week’s opening trading range. Markets will be on the lookout for speeches from ECB policymakers, but officials are broadly expected to avoid rocking the boat amidst holiday-constrained market flows.
Gold price drops amid higher US yields awaiting next week's US inflation

Gold remained at familiar levels on Wednesday, trading near $2,312 amid rising US Treasury yields and a strong US dollar. Traders await unemployment claims on Thursday, followed by Friday's University of Michigan Consumer Sentiment survey.
Bitcoin price drops, but holders with 100 to 1000 BTC continue to buy up

Bitcoin price action continues to show a lack of participation from new traders, steadily grinding south in the one-day timeframe, while the one-week period shows a horizontal chop. Meanwhile, data shows that some holder segments continue to buy up.
Navigating the future of precious metals

In a recent episode of the Vancouver Resource Investment Conference podcast, hosted by Jesse Day, guests Stefan Gleason and JP Cortez shared their expert analysis on the dynamics of the gold and silver markets and discussed legislative efforts to promote these metals as sound money in the United States.