EUR/USD Current price: 1.3524
View Live Chart for the EUR/USD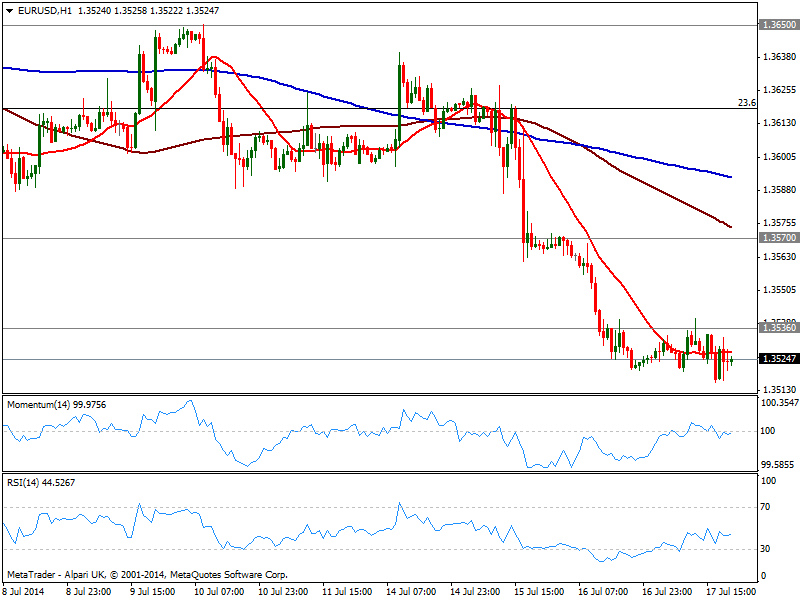
A Malaysian plane was brought down by a ground-to-air missile in the Ukraine/Russia border and, unfortunately, an extreme quiet trading day was interrupted by a strong demand of safe havens mid American afternoon. Such an aberrant act cost the lives of 295 innocent victims and will likely affect the political and economic relationships between major economies from now own, as tougher sanctions may be imposed.
The EUR/USD traded in a tight range for most of the day, having posted a lower low of 1.3515 and having been unable to advance beyond 1.3535 static resistance level. Technically, the pair maintains a neutral stance in the short term, as per the hourly chart showing indicators around their midlines and price moving back and forth around a flat 20 SMA. In the 4 hours chart indicators stand flat near oversold levels as moving averages hold well above current price. Downward pressure remains intact and risk to the downside increased with latest developments, looking for a probable test of 1.3475 for the upcoming sessions.
Support levels: 1.3500 1.3476 1.3440
Resistance levels: 1.3535 1.3570 1.3620
EUR/JPY Current price: 137.00
View Live Chart for the EUR/JPY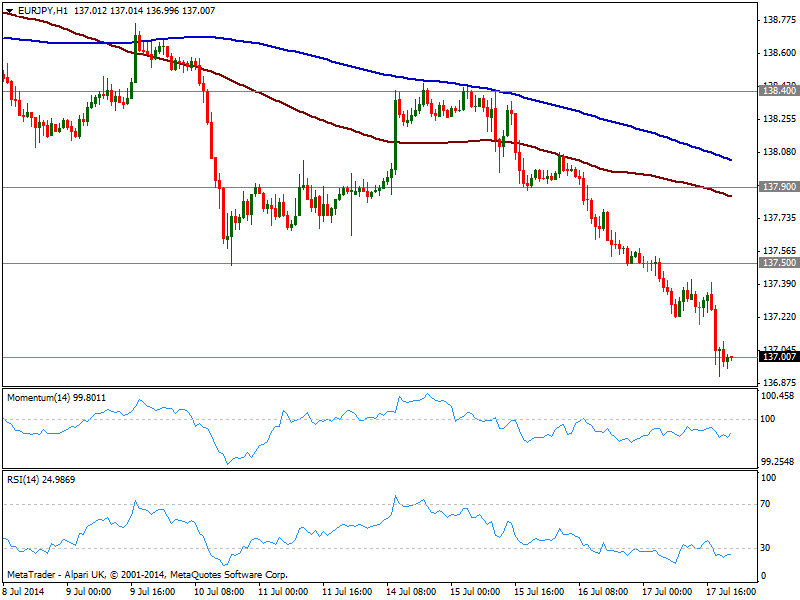
Yen was up early Thursday on falling US yields, down to 2.47% late US afternoon. But the Japanese currency rally was fueled by news, sending EUR/JPY a few pips below the 137.00 mark where it stands. US stocks turned south also closing in deep red and erasing Wednesday gains, which also weighs on yen pairs. Technically, the hourly chart shows price pressuring the lows and moving averages gaining bearish slope above current price, as indicators stand flat in negative territory. In the 4 hours chart however, there is a strong bearish momentum that supports a continued slide towards 136.60 immediate support. A break below this last, will be quite significant for the pair, pointing then for a probable continuation towards the 135.00 level over the days to come.
Support levels: 136.90 136.60 136.20
Resistance levels: 137.50 137.90 138.40
GBP/USD Current price: 1.7111
View Live Chart for the GBP/USD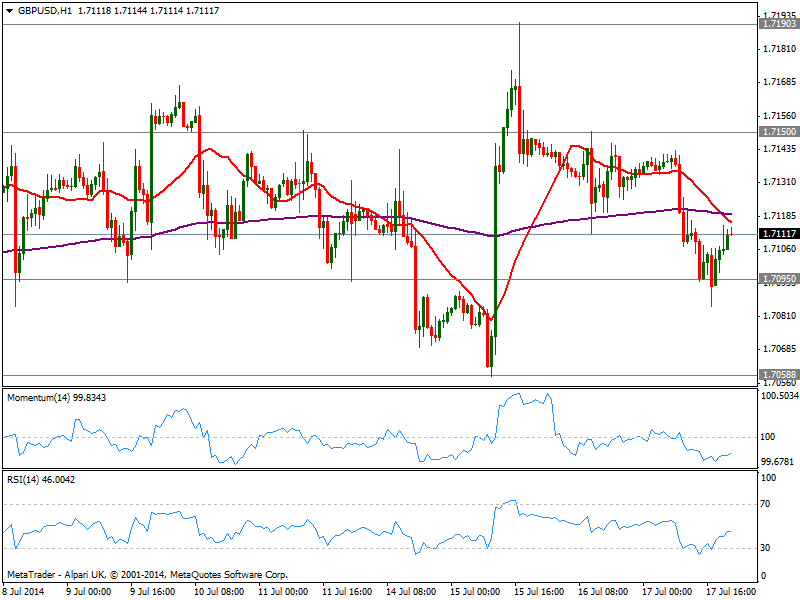
The GBP/USD has shown little progress over the last 24 hours, losing however some ground intraday: the pair fell as low as 1.7085 but quickly bounced back above the 1.7100 level. Nevertheless, the short term technical picture is bearish, with price below its 20 SMA and indicators losing upward potential well below their midlines. In the 4 hours chart a mild bearish tone is present but the movement will hardly gain momentum at current levels: a break below 1.7060 is required to confirm a move lower, towards critical 1.7000/20 price zone.
Support levels: 1.7095 1.7060 1.7020
Resistance levels: 1.7120 1.7150 1.7180
USD/JPY Current price: 101.24
View Live Chart for the USD/JPY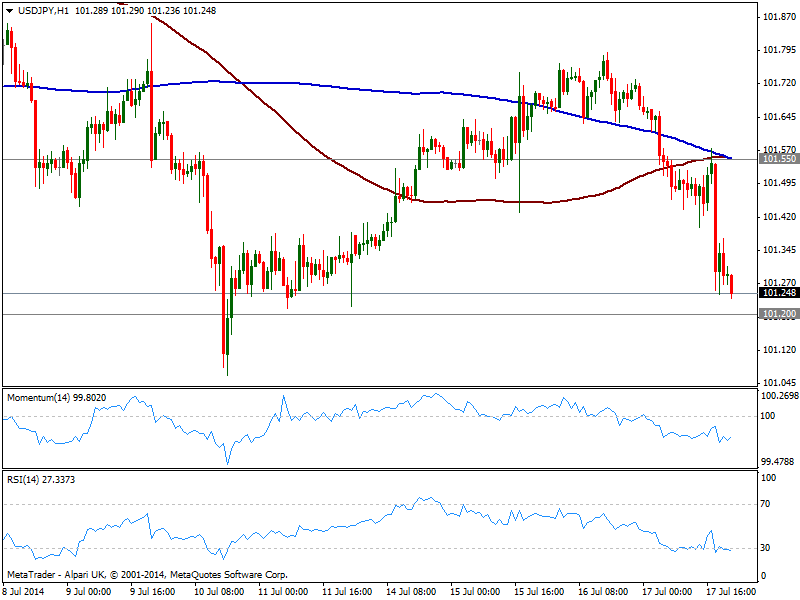
The USD/JPY extends its slide early Asian session, testing 101.20 strong static support level and with a clear bearish bias in its intraday charts: the hourly chart shows now 100 and 200 SMA converging in the 101.50 region acting as immediate intraday resistance while indicators remain in negative territory, and even RSI turns south in oversold levels. In the 4 hours chart technical readings present a strong bearish momentum, looking for a probable test of the year low around 100.70 as long as 101.40/60 area continues to contain the upside.
Support levels: 101.20 100.70 100.35
Resistance levels: 101.55 101.95 102.35
AUD/USD Current price: 0.9375
View Live Chart for the AUD/USD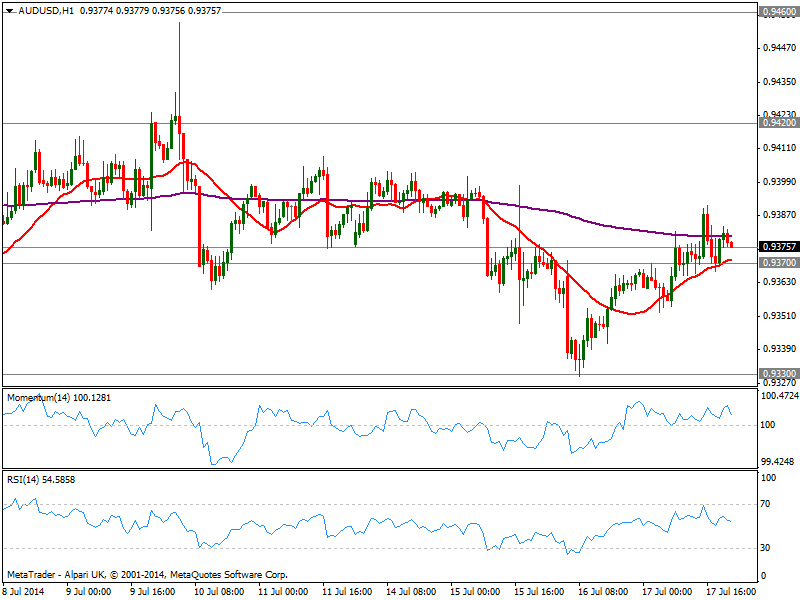
Australian dollar managed to regain some ground, advancing up to 0.9390 on the day against the greenback, and holding above 0.9370 immediate support ahead of Asian opening. In the hourly chart, however, the upward momentum eases, with indicators turning lower towards their midlines; in the same time frame, 20 SMA maintains a bullish slope and converges with mentioned static support, so a break below it should anticipate further falls. In the 4 hours chart technical readings stand in neutral territory, giving not much clues on what’s next: a break below 0.9330 strong static support area is required to confirm a bearish continuation, looking then for a test of 0.9250/60 price zone.
Support levels: 0.9370 0.9330 0.9300
Resistance levels: 0.9420 0.9460 0.9500
Recommended Content
Editors’ Picks
EUR/USD clings to gains above 1.0750 after US data

EUR/USD manages to hold in positive territory above 1.0750 despite retreating from the fresh multi-week high it set above 1.0800 earlier in the day. The US Dollar struggles to find demand following the weaker-than-expected NFP data.
GBP/USD declines below 1.2550 following NFP-inspired upsurge

GBP/USD struggles to preserve its bullish momentum and trades below 1.2550 in the American session. Earlier in the day, the disappointing April jobs report from the US triggered a USD selloff and allowed the pair to reach multi-week highs above 1.2600.
Gold struggles to hold above $2,300 despite falling US yields

Gold stays on the back foot below $2,300 in the American session on Friday. The benchmark 10-year US Treasury bond yield stays in negative territory below 4.6% after weak US data but the improving risk mood doesn't allow XAU/USD to gain traction.
Bitcoin Weekly Forecast: Should you buy BTC here? Premium

Bitcoin (BTC) price shows signs of a potential reversal but lacks confirmation, which has divided the investor community into two – those who are buying the dips and those who are expecting a further correction.
Week ahead – BoE and RBA decisions headline a calm week

Bank of England meets on Thursday, unlikely to signal rate cuts. Reserve Bank of Australia could maintain a higher-for-longer stance. Elsewhere, Bank of Japan releases summary of opinions.