Chart of the Week: AUD/USD bears back in play
- AUD/USD bears are back in charge for the open in anticipation of a break of 4-hour support.
- A break of support will finally open prospects of a daily and weekly bearish continuation.

Since June, AUD/USD has been analysed as technically bearish in a series of articles:
- Chart of the Week: Commodity currencies in focus, bears in control
- AUD/USD downside compelling for the days ahead
- AUD/USD Price Analysis: Bulls coming up for their last breath?
- Aussie Covid spread tainting bullish appetite in AUD
While there has been a bearish bias, shorts have been squeezed back into the 0.74 area within the constructively bearish deceleration of the correction.
However, Friday's price action was definitely bearish and renews prospects of a downside continuation after all for the week ahead.
From a 4-hour perspective, the price needs to break and close below 0.7330:
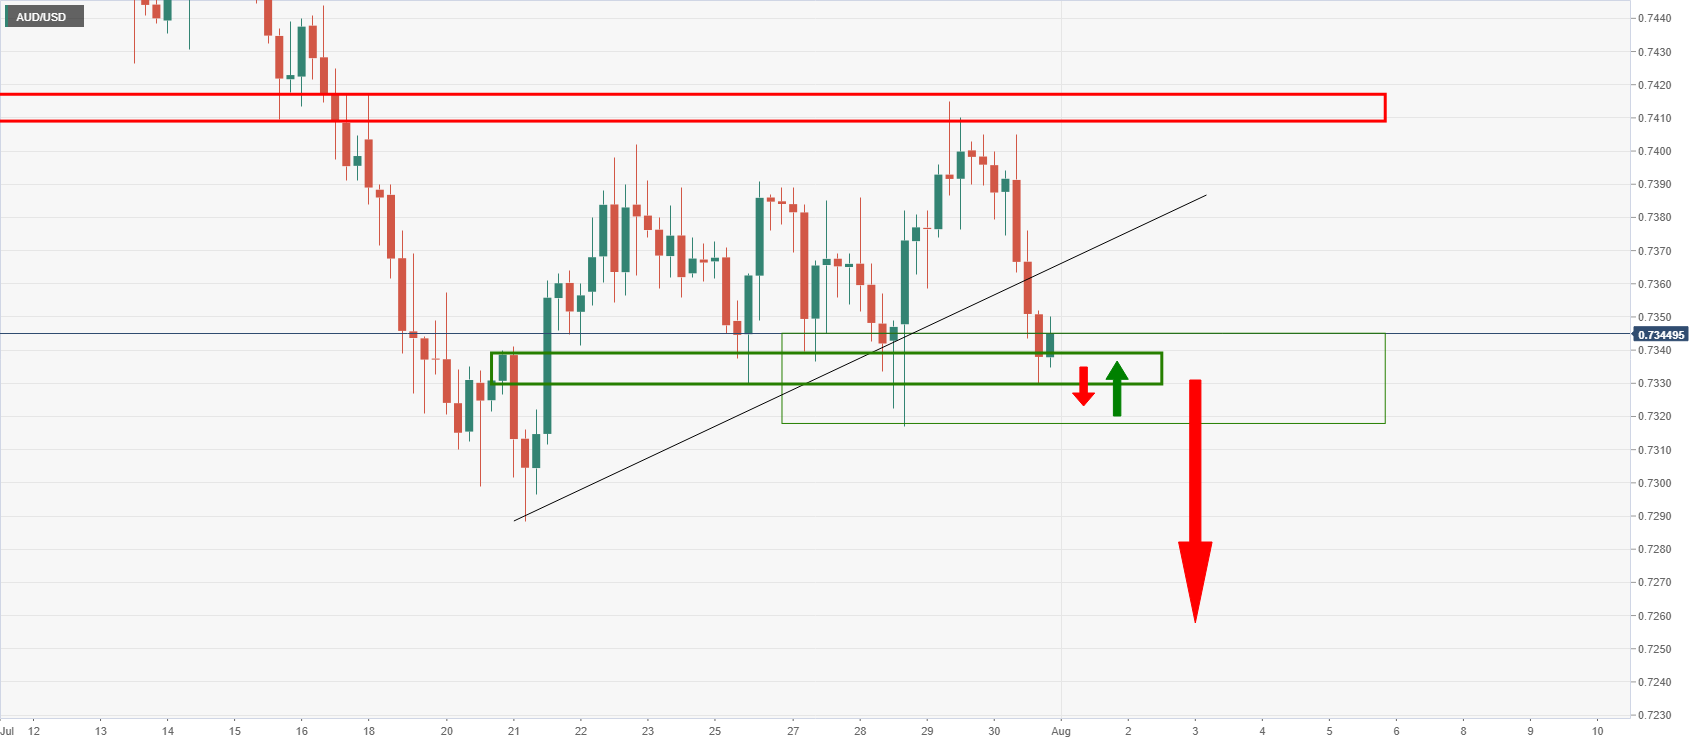
How probable are the chances of that?
Considering the fundamentals alone, there is a high chance that the price moves lower.
However, from a technical standpoint, the chance is even likelier taking into consideration the US dollar's technical foundations as well as the longer-term charts in AUD/USD.
Starting with those, AUD/USD is breaking the monthly support as follows:
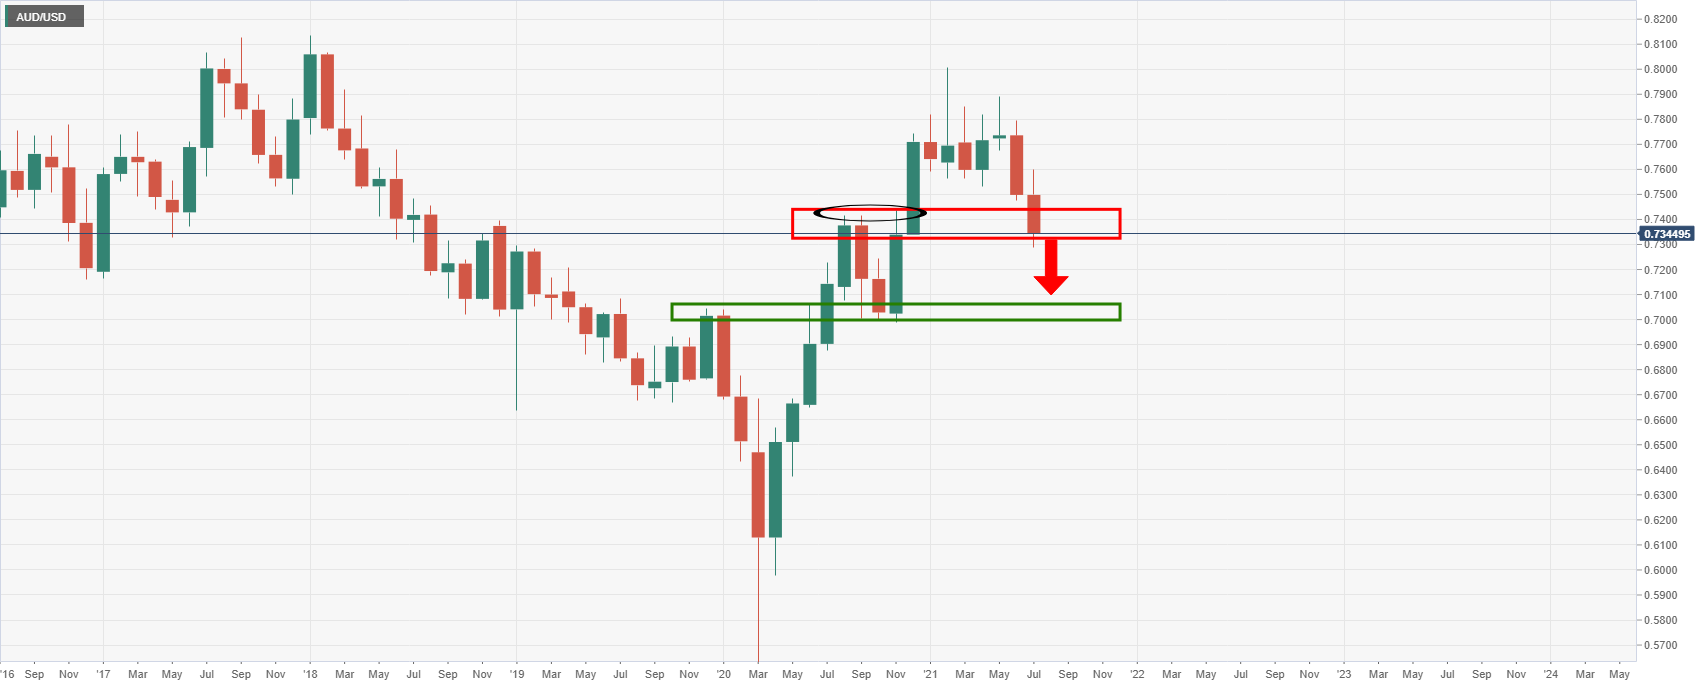
0.7413 was broken and the monthly candle ended bearish, with the close below old support.
This leaves prospects of a downside continuation on the cards for the month ahead.
From a weekly perspective, the bears can seek a deeper test of bullish commitments from within the mid-November range between 0.7220 and 0.7340.
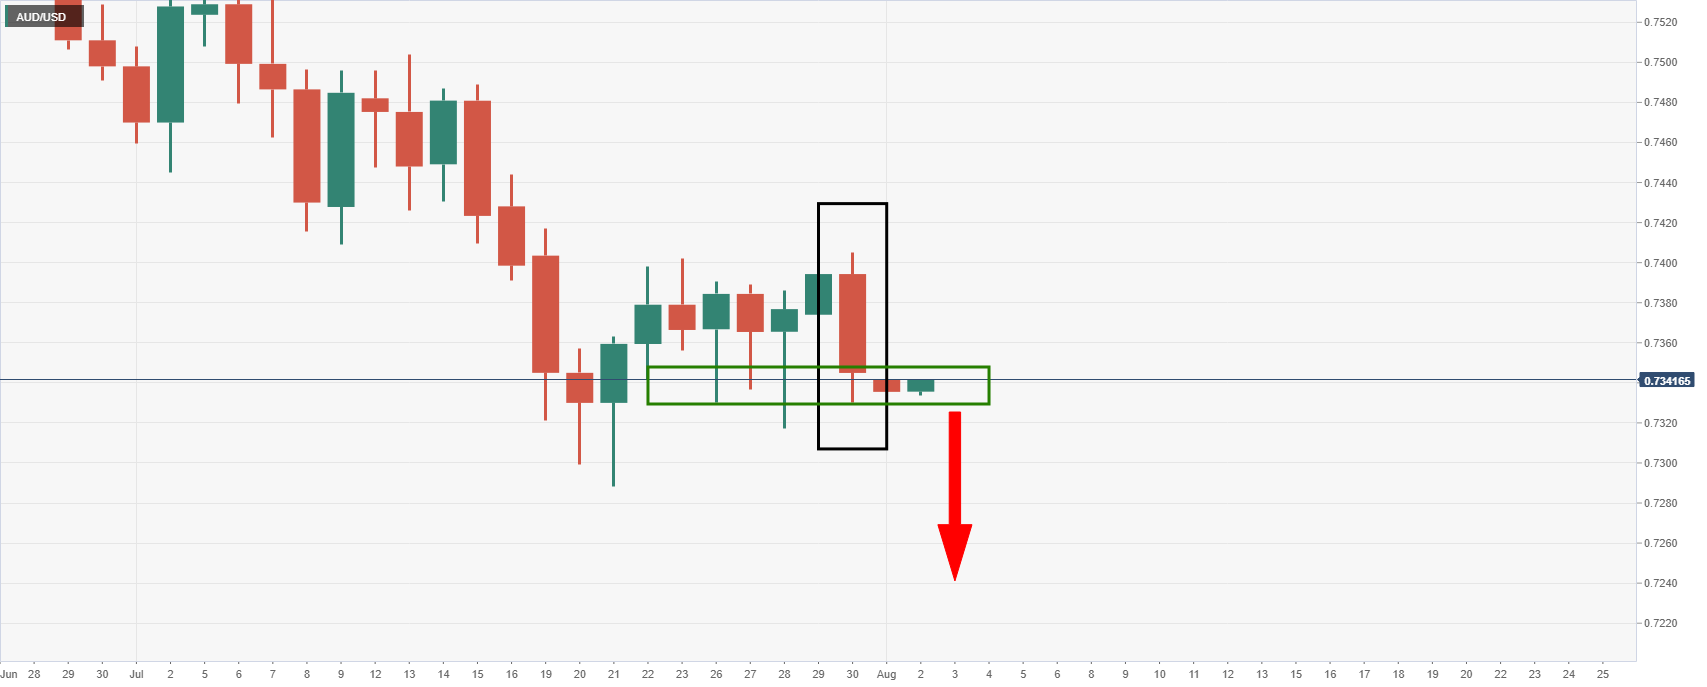
From a daily perspective, the bearish engulfing close is highly bearish for the open:
US dollar analysis
In prior analysis post the Fed drop, it was argued that the price would revert to the upside again as follows:
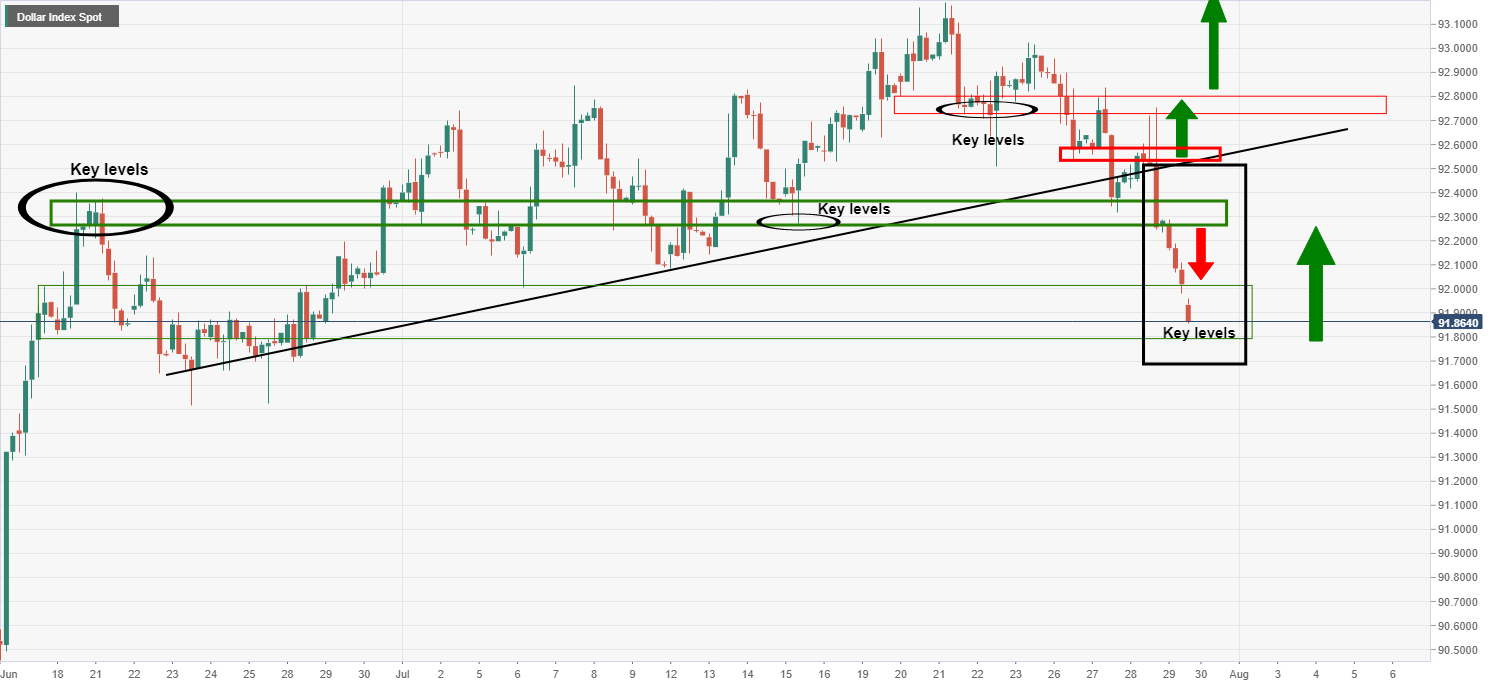
Live market, 4-hour & daily chart, DXY
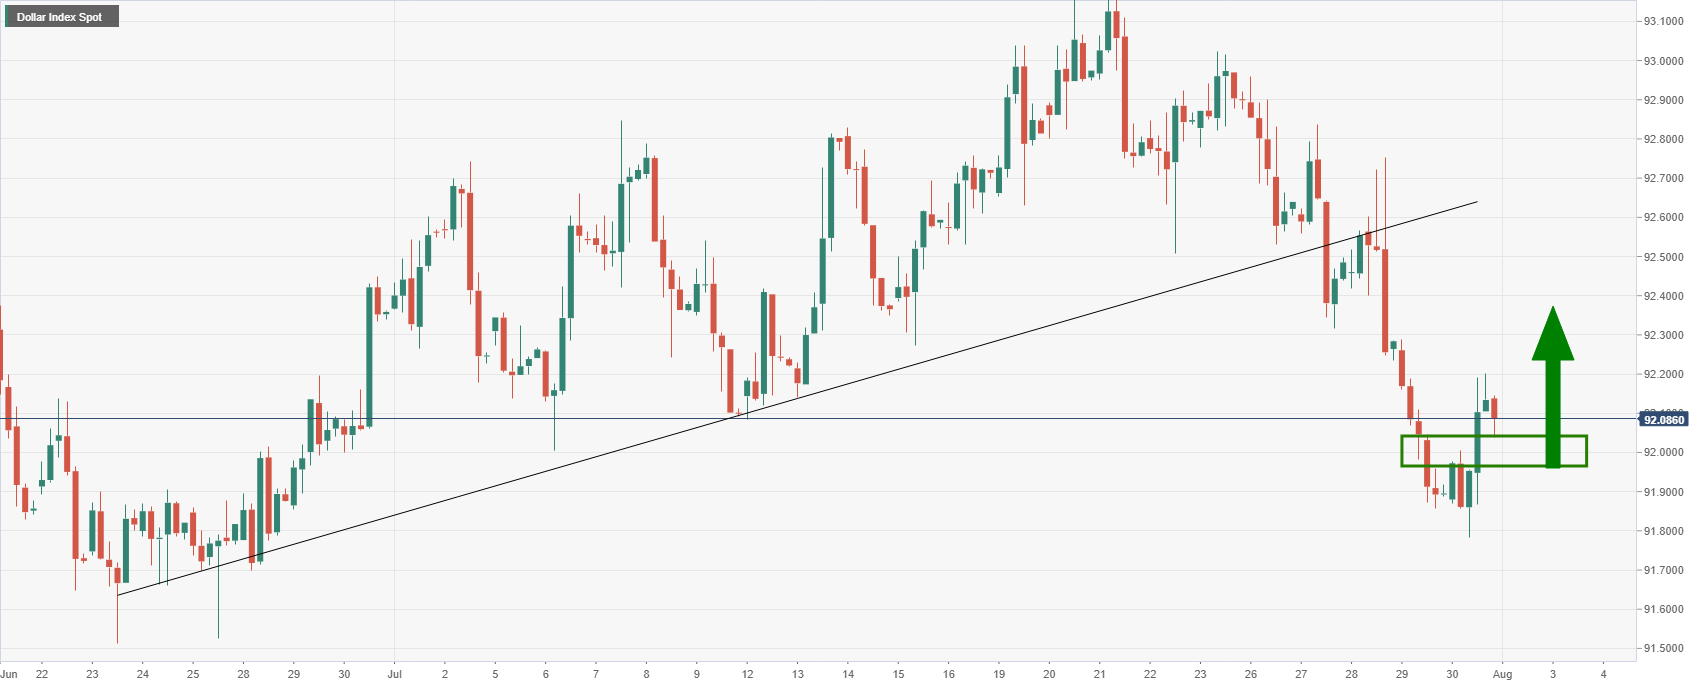
The price tested very deep into demand but has now started to turn higher in a correction that could run for some distance according to the daily chart:
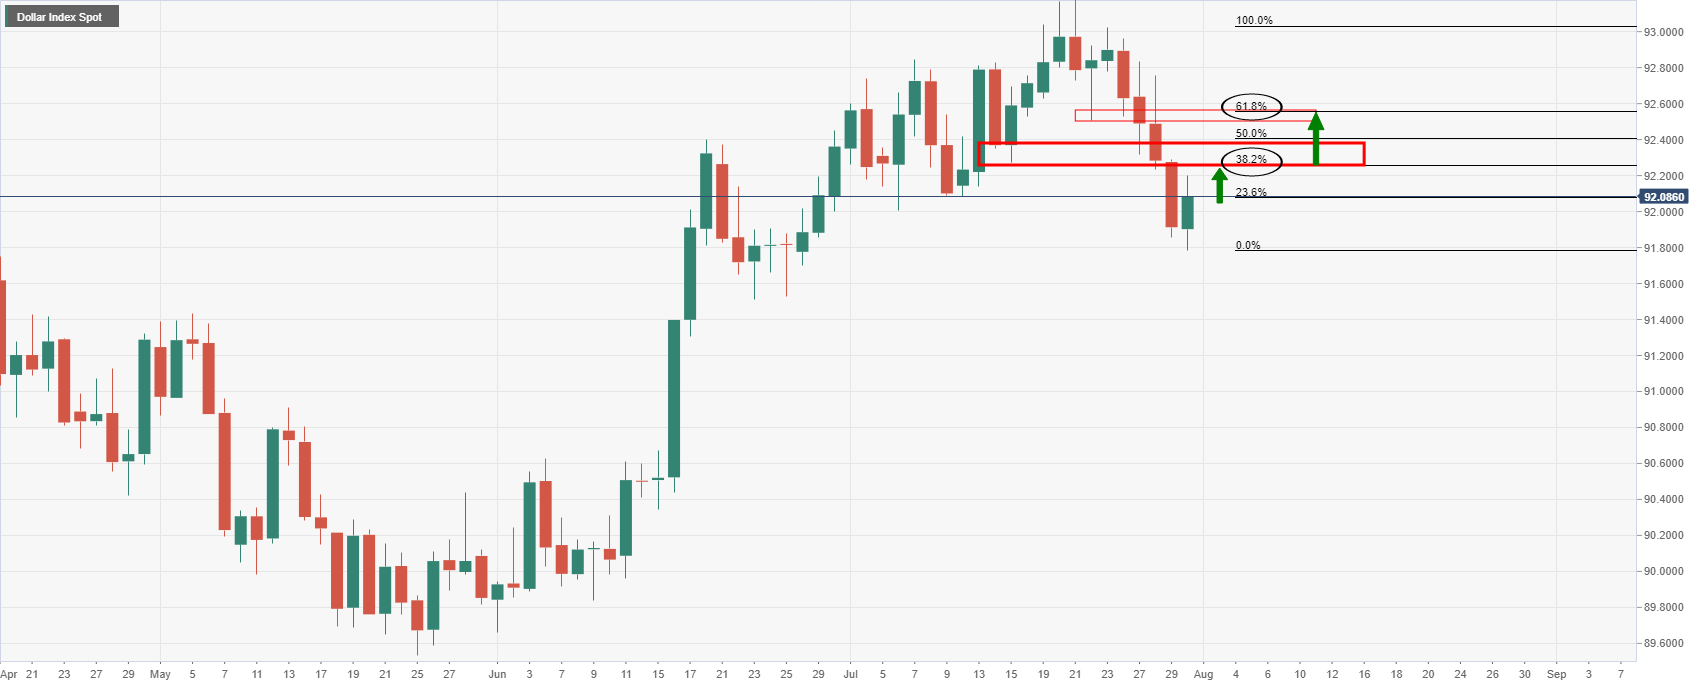
First and foremost, the M-formation is a bullish structure. The 38.2% Fibo aligns with old support as the first confluence of resistance before the 61.8% confluence with the M-formation's neckline lows.
Premium
You have reached your limit of 3 free articles for this month.
Start your subscription and get access to all our original articles.
Author

Ross J Burland
FXStreet
Ross J Burland, born in England, UK, is a sportsman at heart. He played Rugby and Judo for his county, Kent and the South East of England Rugby team.


