Wheat is the Big Daddy of the agricultural commodity sector. World trade in wheat is greater than that of all other crops combined while it is grown on more land than any other food.
Let’s analyse the technicals of this commodity behemoth using the yearly, monthly and weekly charts.
WHEAT YEARLY CHART
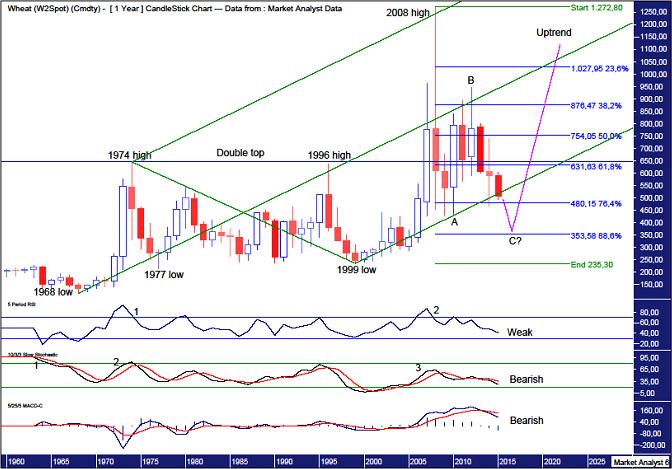
I have drawn a horizontal line connecting the 1974 and 1996 highs. This was a double top and considering it was against the trend it was no surprise to see price eventually trade back up and bust it convincingly. Price then put in a spike high in 2008 at US$1272.
I have drawn an Andrew’s Pitchfork and this spike high was right at resistance given from the upper channel line. Since then price has pulled back all the way to support given from the lower channel line. A move back up was rejected around the middle channel line and now price is back at the lower channel line. Highs and lows often make false breaks of the Andrew’s Pitchfork and I suspect the support from the lower channel line will give way shortly.
To my eye, it looks like an ABC corrective pattern is playing out with price now on its way to a wave C low.
As for where any coming major low will be, I have added Fibonacci retracement levels of the move up from the 1999 low to 2008 high. I am looking for the final pullback low to be somewhere around the 88.6% level which stands at US$353.
The Relative Strength Indicator (RSI) showed a bearish divergence at the 2008 high and is now trending down and looking weak. Perhaps after the coming low price then heads back up to new all time highs which is accompanied by a triple bearish divergence.
The Stochastic indicator showed a triple bearish divergence at the 2008 high and is now trending down with a bearish bias.
The Moving Average Convergence Divergence (MACD) indicator is showing a recent bearish crossover and is also now trending down with a bearish bias.
WHEAT MONTHLY CHART
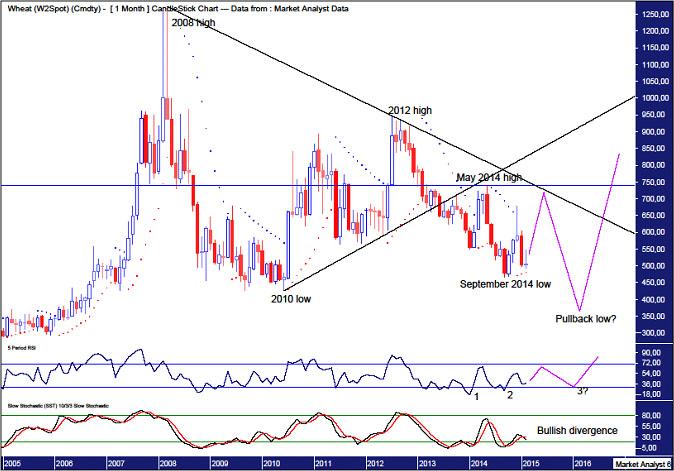
I have drawn an uptrend line from the 2010 low. Price broke down below this trend line in mid 2013 while the recent May 2014 high was rejected at this trend line which is a bearish development.
The Parabolic Stop and Reverse (PSAR) indicator currently has a bullish bias and price looks to be testing that support now given by the dots on the downside. If that support can hold then perhaps a more substantial rally can occur.
The September 2014 low was accompanied by a bullish divergence in the RSI. I would like to see a rally now and then a move to new lows which is accompanied by a triple bullish divergence. Let’s see.
The Stochastic indicator also shows a bullish divergence at the October 2014 low so a rally now certainly has potential.
I have drawn a downtrend line connecting the 2008 and 2012 highs and perhaps any rally now will be rejected at that trend line.
I have drawn a horizontal line denoting the May 2014 high and, considering I expect a bear rally only, price should not trade above that level of US$739.
WHEAT WEEKLY CHART
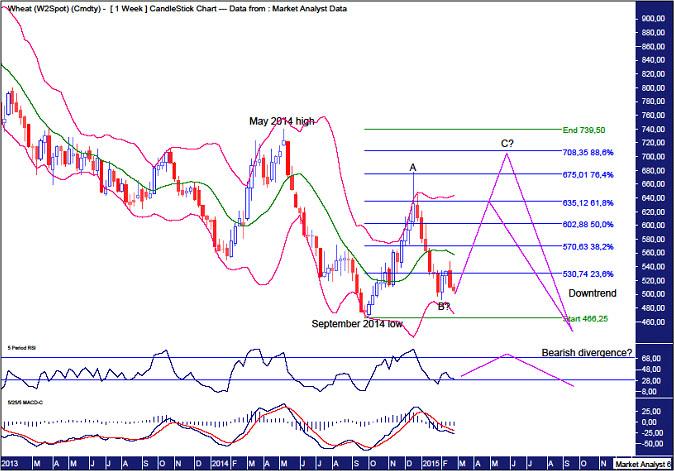
There looks like there may be an ABC corrective pattern playing out with the wave A high already in place. The wave B low may also be in place but I haven’t discounted the possibility that price may still be tracing out this B wave. Any rally should then be wave C which I favour to put in a new high but consideration must also be given to it truncating.
I have added Fibonacci retracement levels of the move down from the May 2014 high to September 2014 low. The wave A high was right at the 76.4% level so a new high would likely be around the 88.6% level at US$708. If price were to truncate then the 61.8% level at US$635 would be right in contention.
The Bollinger Bands show the wave A high traded well above the upper band which would seem to favour the wave C rally truncating although two consecutive highs well above the upper band would certainly be bearish. The upper band is currently around the 61.8% Fibonacci retracement level. Price is now back down at the lower band and I am obviously expecting price to bounce off this band. Which scenario do I favour? I lean slightly to the wave C high being marginally higher than the wave A high.
The wave A high was accompanied by a new high in the RSI and I’d like to see the wave C high set up a bearish divergence.
The MACD indicator is still trending down with a bearish bias so caution does need to be heeded.
After the expected coming rally high price should then turn back down and head to new lows.
The above is a matter of opinion provided for general information purposes only and is not intended as investment advice. Information and analysis above are derived from sources and utilising methods believed to be reliable, but we cannot accept responsibility for any losses you may incur as a result of this analysis. Individuals should consult with their personal financial advisors. Put simply, it is JUST MY OPINION.
Recommended Content
Editors’ Picks
EUR/USD clings to gains above 1.0750 after US data

EUR/USD manages to hold in positive territory above 1.0750 despite retreating from the fresh multi-week high it set above 1.0800 earlier in the day. The US Dollar struggles to find demand following the weaker-than-expected NFP data.
GBP/USD declines below 1.2550 following NFP-inspired upsurge

GBP/USD struggles to preserve its bullish momentum and trades below 1.2550 in the American session. Earlier in the day, the disappointing April jobs report from the US triggered a USD selloff and allowed the pair to reach multi-week highs above 1.2600.
Gold struggles to hold above $2,300 despite falling US yields

Gold stays on the back foot below $2,300 in the American session on Friday. The benchmark 10-year US Treasury bond yield stays in negative territory below 4.6% after weak US data but the improving risk mood doesn't allow XAU/USD to gain traction.
Bitcoin Weekly Forecast: Should you buy BTC here? Premium

Bitcoin (BTC) price shows signs of a potential reversal but lacks confirmation, which has divided the investor community into two – those who are buying the dips and those who are expecting a further correction.
Week ahead – BoE and RBA decisions headline a calm week

Bank of England meets on Thursday, unlikely to signal rate cuts. Reserve Bank of Australia could maintain a higher-for-longer stance. Elsewhere, Bank of Japan releases summary of opinions.


