AUD/USD Forecast: No changes to the consolidative theme
- AUD/USD keeps hovering in the sub-0.6600 zone.
- Retail Sales in Australia disappointed expectations.
- Investors’ attention now shifts to inflation figures.

Once again, AUD/USD exhibited an erratic performance on Tuesday, remaining ensnared in a rangebound pattern that has persisted since the middle of this month. That said, spot faded the promising start to the week, with the Australian dollar weakening on a daily basis in tandem with the decent gains in the greenback.
In the meantime, the resilience of the Australian currency is notable, particularly in light of recent reports suggesting additional stimulus measures by the PBoC to support China's stock market and promote economic recovery in the post-pandemic era. However, these efforts, aimed at boosting the economy, have been slower to materialize than expected.
On another front, the expected decision of the Reserve Bank of Australia (RBA) to maintain its current policy stance at its February 6 meeting is viewed as a factor limiting the potential upward movement of the pair in the near term, which should morph into extra-subdued trading in the short-term future.
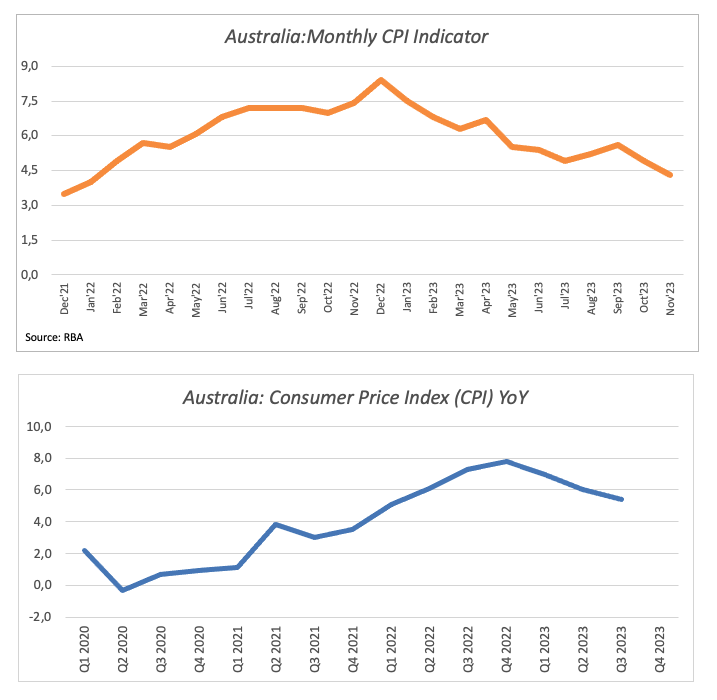
Back to the RBA, the recorded decrease in inflation metrics in December, alongside the perceived tightness in the labour market, has strengthened the consensus among market participants that the central bank will keep its current interest rates unchanged at next week’s event.
Looking at central banks more broadly, the possibility of the Federal Reserve extending its ongoing restrictive stance for a longer duration than anticipated is expected to support additional gains in the US Dollar, thus acting as a drag for the AUD/USD for the time being.
Moving forward, the Inflation Rate is due on Wednesday and is expected to see a marked continuation of the disinflationary path in the domestic economy during the October–December period. In fact, consensus sees consumer prices rising 0.8% QoQ (from 1.2%) and 4.3% YoY (from 5.4%), all lending further legs to the perception that the RBA should maintain its monetary policy unchanged at its imminent gathering.
AUD/USD daily chart
AUD/USD short-term technical outlook
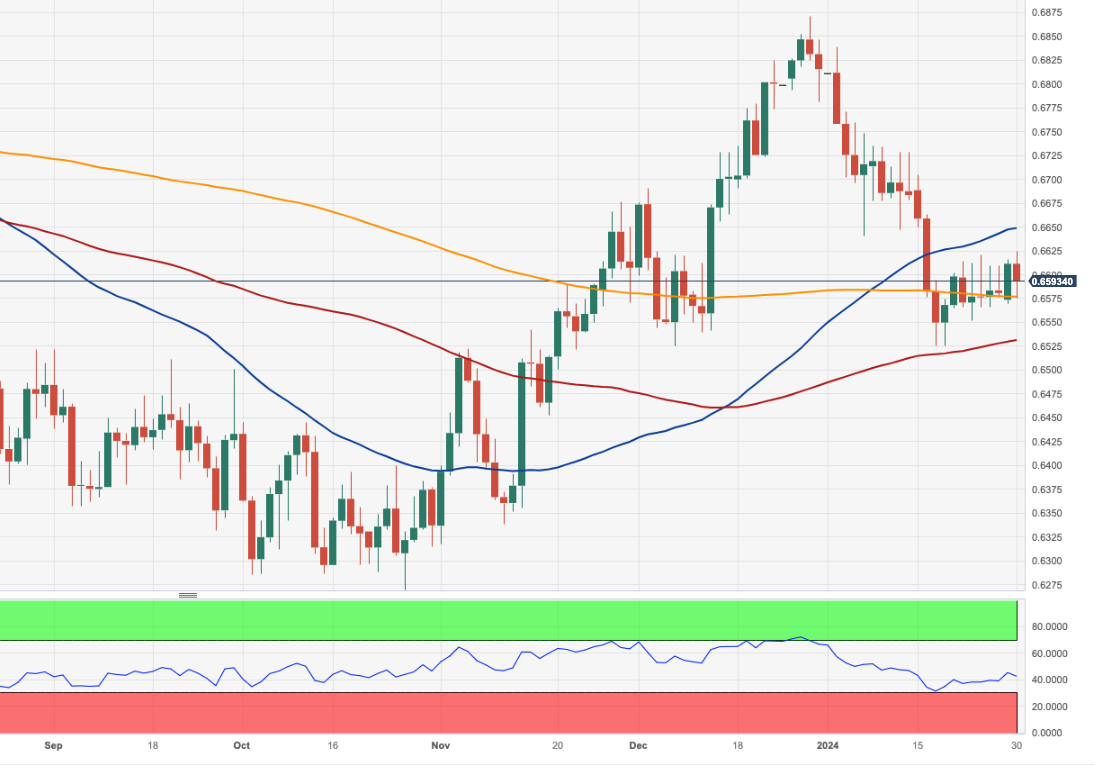
Further losses might push the AUD/USD to revisit its 2024 low of 0.6524 (January 17). The loss of this region may result in a decline to the provisional 100-day SMA of 0.6526, which coincides with the December 2023 bottom (December 7). Down from here follows the 2023 low of 0.6270 (October 26) and the round level of 0.6200, all of which are preceding the 2022 low of 0.6169 (October 13). On the contrary, there is a brief stumbling block at the 55-day SMA at 0.6642. The breakout of this zone might inspire the pair to set sails for the December 2023 top of 0.6871 (December 28), ahead of the July 2023 peak of 0.6894 (July 14) and the June 2023 high of 0.6899 (June 16), all just ahead of the key 0.7000 threshold.
Further consolidation seems the name of the game for the pair on the 4-hour chart. On the upside, the 100-SMA is now at 0.6623, while the 200-SMA is at 0.6683. The breach of this region signals a possible move to 0.6728. On the downside, there is early dispute around 0.6551 before 0.6525. If this zone is broken, there is no major disagreement until 0.6452. The MACD remains flat around the positive border, while the RSI grinds lower to the 45 region.
Author

Pablo Piovano
FXStreet
Born and bred in Argentina, Pablo has been carrying on with his passion for FX markets and trading since his first college years.
















