- AUD/USD to remain neutral around 0.7500 for longer, sentiment suggests downside beginning to get exhausted.
- Mixed signals around the pair left traders clueless on upcoming direction.
The Australian dollar ends the week modestly up against the greenback, although below a key Fibonacci resistance and of its weekly high, with a sharp advance in worldwide equities saving the week for the AUD. The rally in equities was triggered by headlines indicating that the trade war between China and the US was on a brink of getting solved, with encouraging headlines coming from representatives of both economies. The positive sentiment was wiped out by US President Trump, who twitted mid-week that he was not satisfied with the ongoing developments, indicating that there is a strong way ahead before both economies reach an actual deal. Risk aversion took over markets, but Fed's tolerant stance to "modest overshooting" inflation keep equities afloat, and therefore the Aussie.
Commodities, which also have a strong influence in the AUD, offered a mixed picture, with crude retreating sharply after hitting fresh multi-year highs, but gold recovering the 1,300.00 threshold.
Neither Australia nor China, released relevant data these last few days that could shake the pair, although Australia’s Westpac leading index rebounded 0.2% on a monthly basis in April, compared to a revised fall of 0.1% in the previous month. The index, which indicates the likely pace of economic activity relative to trend three to nine months into the future, indicates that growth is now above trend, but moving at a slow pace. Nothing there that can affect the current RBA stance.
For the upcoming days, the calendar will also be light, but there are some headlines scheduled that can affect the Aussie, starting with building permits on Wednesday, expected to have declined in April by 3.0%, and May New Home Sales to be out on Friday. China will offer this week May manufacturing and non-manufacturing PMI, which will offer a picture on how the world's second-largest economy is doing these days.
The American dollar, on the other hand, has partially lost its shine due to renewed geopolitical tensions between the US and China and North Korea, and the not-so-hawkish Fed's statement released these days. Sentiment through equities will probably lead the way for the AUD/USD pair this upcoming week.
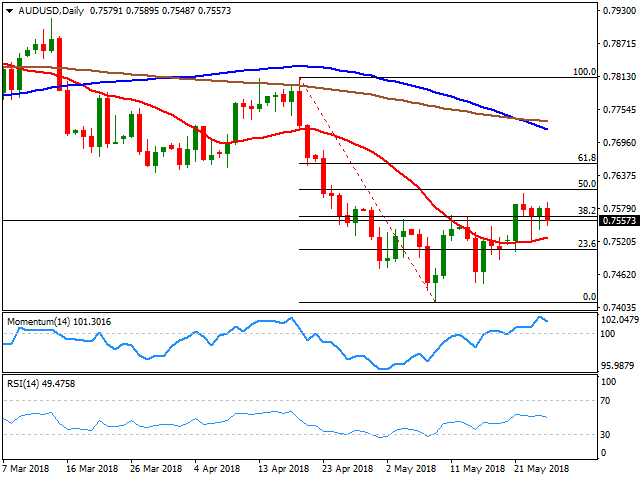
AUD/USD technical outlook
The AUD/USD pair corrected up to the 50% retracement of its latest weekly decline, ending the week a few pips below the 38.2% retracement of the same slide at 0.7565. The weekly chart shows that it’s the third consecutive one that the pair holds around the current levels, with the candles showing small bodies, but for a change, this last time it managed to post a higher high and a higher low.
The battle for direction continues, although the risk remains skewed to the downside according to technical readings in the weekly chart, as the pair is developing below all of its moving averages, with the 100 SMA being the closest one, and converging with the 61.8% retracement of the mentioned decline at around 0.7655. The Momentum indicator in the mentioned chart has turned south within negative territory, while the RSI hovers around 41. In the daily chart, however, the pair managed to recover and settle above a modestly bullish 20 DMA, while technical indicators retreat within positive territory, not enough to suggest an upcoming decline. The 0.7505 Fibonacci level is the immediate support ahead of the low set at 0.7411, while a break below this last exposes a more relevant long-term support, at 0.7250. To the upside, the 0.7565 level is the first relevant resistance, followed by the mentioned 0.7655 Fibonacci level, with gains beyond this last needed to confirm an interim bottom and further gains ahead.
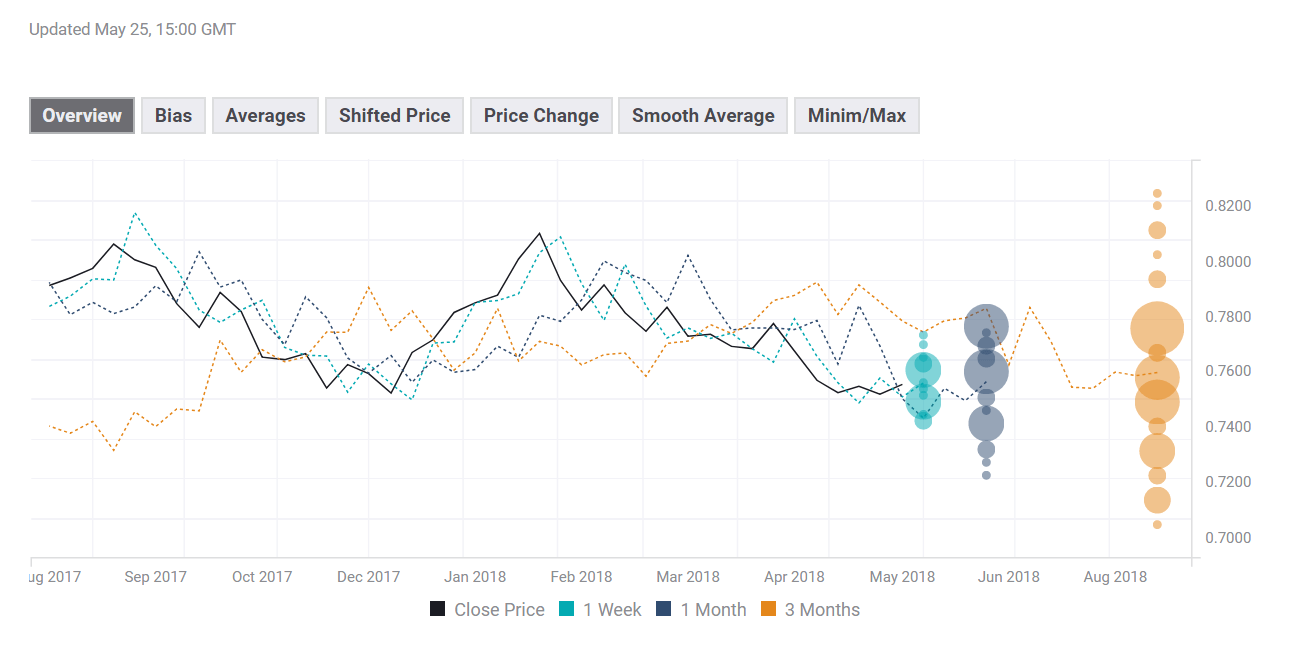
AUD/USD sentiment poll
The FXStreet Forecast Poll reflects the current absence of definitions around the pair, as a neutral stance prevails in the weekly and monthly perspectives. Bulls, however, are up in both time frames but 1 measly percentage point. The average targets have been modestly lifted in both by some 50 pips, somehow suggesting that the downside could be exhausted. Bulls are little changed in the quarterly view, now at 41% and targeting 0.7596, from 42% and 0.7585 the past week.
The overview chart also reflects that bears are losing the grip, with the moving average slowly turning higher in the three time frames under study which may not be enough to confirm an upcoming recovery, but act as a first warning of downward exhaustion. The one month view shows increasing average targets, while in the 3-month view the largest accumulation is now at 0.7800.
Information on these pages contains forward-looking statements that involve risks and uncertainties. Markets and instruments profiled on this page are for informational purposes only and should not in any way come across as a recommendation to buy or sell in these assets. You should do your own thorough research before making any investment decisions. FXStreet does not in any way guarantee that this information is free from mistakes, errors, or material misstatements. It also does not guarantee that this information is of a timely nature. Investing in Open Markets involves a great deal of risk, including the loss of all or a portion of your investment, as well as emotional distress. All risks, losses and costs associated with investing, including total loss of principal, are your responsibility. The views and opinions expressed in this article are those of the authors and do not necessarily reflect the official policy or position of FXStreet nor its advertisers. The author will not be held responsible for information that is found at the end of links posted on this page.
If not otherwise explicitly mentioned in the body of the article, at the time of writing, the author has no position in any stock mentioned in this article and no business relationship with any company mentioned. The author has not received compensation for writing this article, other than from FXStreet.
FXStreet and the author do not provide personalized recommendations. The author makes no representations as to the accuracy, completeness, or suitability of this information. FXStreet and the author will not be liable for any errors, omissions or any losses, injuries or damages arising from this information and its display or use. Errors and omissions excepted.
The author and FXStreet are not registered investment advisors and nothing in this article is intended to be investment advice.
Recommended Content
Editors’ Picks
EUR/USD holds above 1.0700 ahead of key US data

EUR/USD trades in a tight range above 1.0700 in the early European session on Friday. The US Dollar struggles to gather strength ahead of key PCE Price Index data, the Fed's preferred gauge of inflation, and helps the pair hold its ground.
USD/JPY stays above 156.00 after BoJ Governor Ueda's comments

USD/JPY holds above 156.00 after surging above this level with the initial reaction to the Bank of Japan's decision to leave the policy settings unchanged. BoJ Governor said weak Yen was not impacting prices but added that they will watch FX developments closely.
Gold price oscillates in a range as the focus remains glued to the US PCE Price Index

Gold price struggles to attract any meaningful buyers amid the emergence of fresh USD buying. Bets that the Fed will keep rates higher for longer amid sticky inflation help revive the USD demand.
Sei Price Prediction: SEI is in the zone of interest after a 10% leap

Sei price has been in recovery mode for almost ten days now, following a fall of almost 65% beginning in mid-March. While the SEI bulls continue to show strength, the uptrend could prove premature as massive bearish sentiment hovers above the altcoin’s price.
US core PCE inflation set to signal firm price pressures as markets delay Federal Reserve rate cut bets

The core PCE Price Index, which excludes volatile food and energy prices, is seen as the more influential measure of inflation in terms of Fed positioning. The index is forecast to rise 0.3% on a monthly basis in March, matching February’s increase.