2020 – The Year Ahead From A Market Timing Perspective

I would like to take this opportunity to share some of the highlights from our 2020 Market Timing Report Special Edition.
2020 is likely to be a turning point year for many reasons and I will explain why shortly.
At Cycles Analysis and The Market Timing Report, we use recurring cycles to forecast ahead both in financial markets and also geopolitical events. I am honoured to have this work recognised as a board member of the Foundation for the Study of Cycles.
These techniques forewarn us and therefore, we are to a degree, forearmed.
In turn this allows us to protect our assets and also be ahead of the game in seeking opportunities for potential growth and benefit.
I would like to start with some of the geopolitical cycles and then look at the stock market.
As our readers were forewarned, we were expecting a significant geopolitical event during the first two weeks of 2020.
This took place on the 3rd January when Trump ordered an airstrike assassinating Iranian General Qasem Soleimani.
The cycles for the Middle East all come together in 2020 to 2021. They are very complex. For the purposes of this article we will keep to the simple recurring patterns.
Firstly, this year will see the 30 year anniversary of Saddam’s invasion of Kuwait.
Thirty years is a common cycle and commodity markets often lead to major highs and lows.
Oil will be very much under the spotlight.
In this chart below, you will be able to see the 10 year pattern for 1990, 2000 and 2010.
The average of these patterns is shown by the thick blue line and what becomes clearly evident is that from the beginning of July both the 10 and 30 year patterns move up rapidly. All three patterns tend to peak round about October.
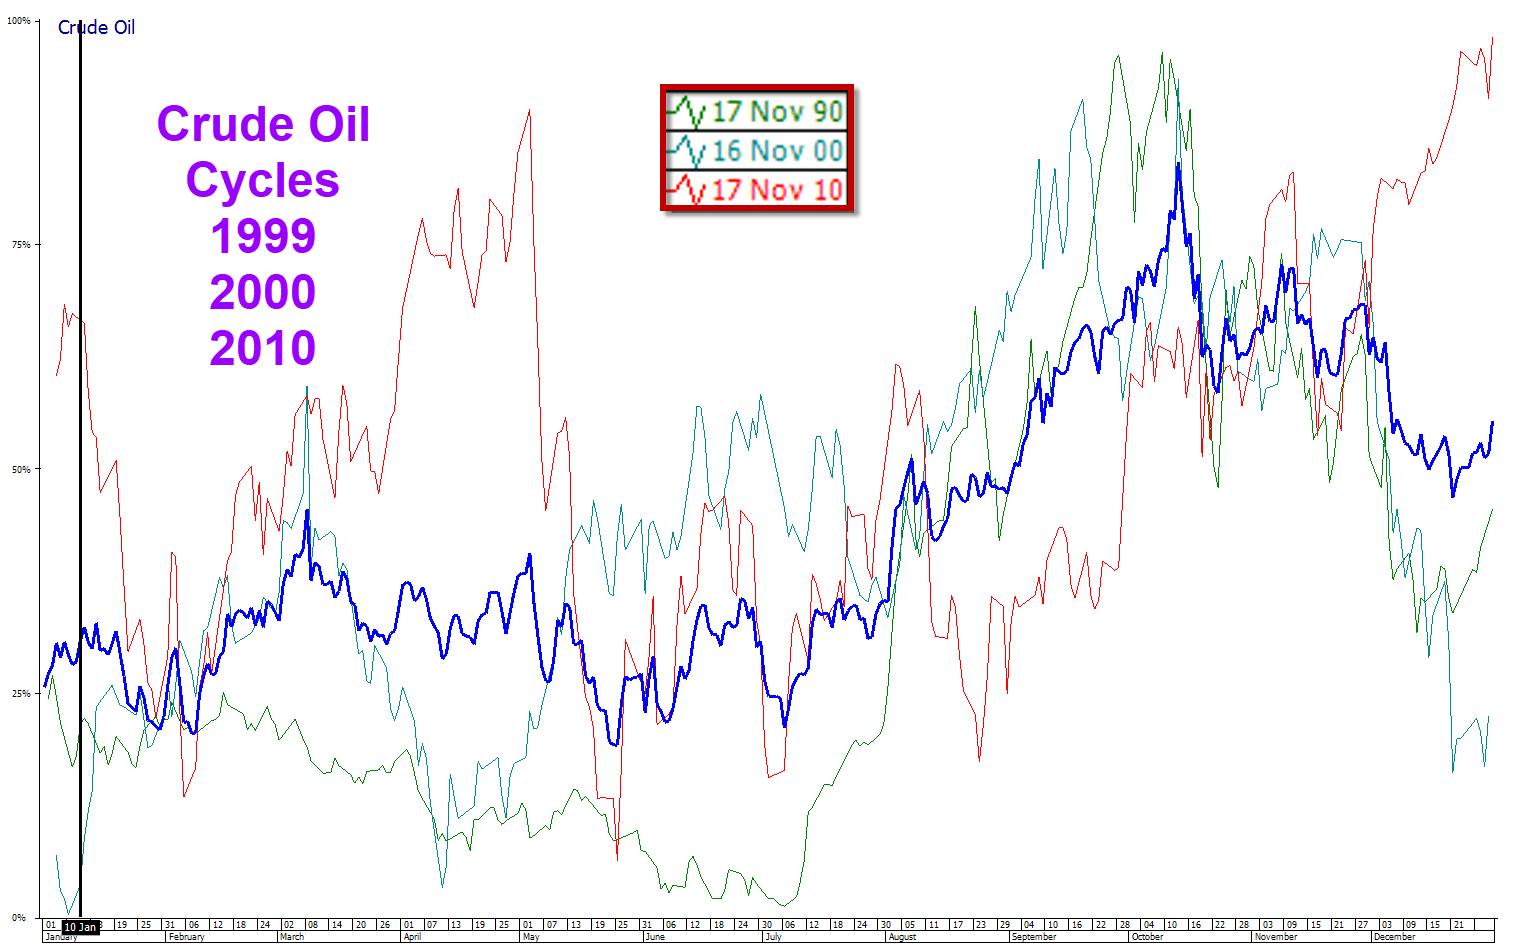
This could be a potential roadmap for crude oil. We will look for short-term confirmation cycles around these time windows.
Further adding to the US-Iran confrontation, we are also 18 years on from the 9/11 attacks. 18 year cycles are not only prevalent in commodity markets but also affect mass psychology. The existence of this cycle suggests an escalation of tension which is exactly what we’ve seen over the last few days with threat and counter threat taking place.
Multiplying the 18 year cycle by 4 gives us a 72 year window. Again 72 years is a critical cycle in human behaviour and also stock markets.
One of the clearest examples is heading back to 1929 and the Wall Street crash. Adding 72 years to 1929 brought us to 2001. Not only did we see all the tech stocks topping out in 2000/2001, but 2001 also saw the attack on New York. What is less well known is that the year 1857 saw one of the globe’s biggest financial panics ever. In the United States following the stock market crash along with free and easy credit, over half the banks failed. In Europe there was a financial meltdown. Taking 1857 and adding 72 years to that took us to 1929. It always pays to watch for the 72 year cycle. If you’re still unconvinced, move back 72 years from 1857! The panic of 1785 lasted through until 1788. This is when the boom that followed the American Revolution finally went to bust. There had been overexpansion, huge debts existed after the American victory at Yorktown and we were now in post-war deflation. But to make matters worse, interstate trade dipped substantially, the British refused to conclude a commercial treaty and there were huge commercial defaults.
The 72 year cycle also works very clearly in the geopolitical arena.
Back in 1947 both India and Pakistan received independence. With that came great strife.
Moving 72 years on from that took us to 2019 and there was a big rise in tensions especially following a suicide car bombing on 14 February 2019 killing 40 security personnel in India. Both nations went on to conduct air strikes against each other.
Returning to the Middle East, in 1948, Israel was born. 2020 sees the 72nd year of its existence and therefore a turning point. It is almost certain that Israel will become involved in the conflict arising from the present Iran America tensions.
Let’s take this a stage further. Some of you will be familiar with my work and previous articles. In these writings I show you how revolutionary cycles work. There is clear evidence to suggest that there are significant regime changes or uprisings every 82 to 84 years. In fact Trump and Brexit are all part of this scenario as I previously discussed. Half of this cycle is 41 to 42 years.
Let’s head back 41 years from 2020 to the year 1979. On February 1, 1979 Ayatollah Khomeni returned to Teheran from Paris. This was the Iranian revolution. Two weeks earlier the Shah of Iran had fled into exile. This suggests that we are at another major turning point for Iran this year.
I think things are likely to get a lot worse before they get better.
We are now in the 45 year cycle from the 1974 OPEC oil crisis. In fact, the Shah of Iran was one of the key proponents of this event, instrumental in hiking oil prices several fold. The effect was quite simple. It would put the Western world into recession. He along with his OPEC colleagues succeeded.
So you can see that we have numerous geopolitical cycles affecting oil and the Middle East all coming together right now suggesting that we are potentially heading into a very big crisis.
Heading back to the 100 year cycle and 1920, free-floating precious metals such as silver made all-time highs in terms of price during the month of January 1920. Gold was fixed in price at the time. This week, we are seeing the highest highs in gold for several years.
By the way, if you’re wondering about whether I am making these numbers up or not, take a look at this. Between 2007 and 2009, we saw the Global Financial Crisis. One hundred years earlier in 1907 The Rich Man’s Panic also known as the Knickerbocker Crisis took place. Head back another 100 years to 1807 and the United States introduced The Embargo Act creating a huge stock collapse and recession. The cycles work as regular as clockwork. In fact, you can take the midpoint of these cycles. 1807+50 years takes us to 1857 – does that sound familiar? If not recap an earlier paragraph! 1907+50 years takes us to 1957 – here the market sold off steadily and strongly as we had seen a peak in manufacturing. Everyone that could afford an automobile or television now had one.
Earlier on, I mentioned the 45 year cycle from the Middle Eastern oil crisis. If you double this cycle up, it takes us back to 1929. 1929 saw the Wall Street crash. On this basis I would not be surprised to see this bull market running out of steam.
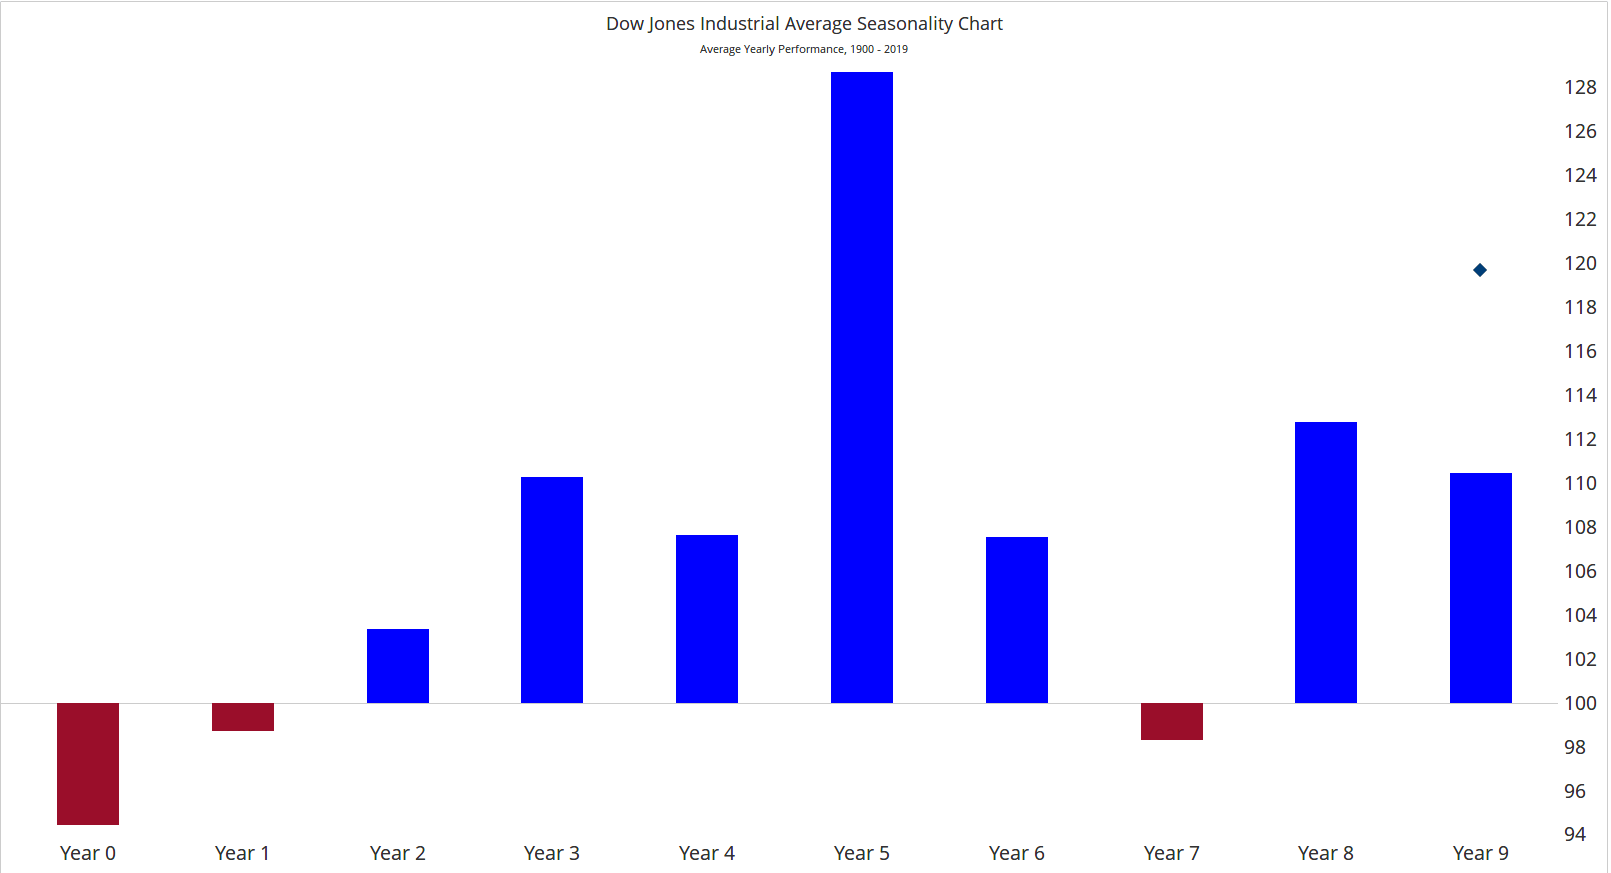
In the chart below, you will see that years ending in”0,” the first year of every decade, are bearish. In fact they are usually the most bearish year of the decade. 2020 is a year ending in “0”. This is based on data heading all the way back to the year 1900 on the Dow Jones Industrial Averages.
Within years ending in 0, this chart shows us that the market tends to be bearish for the first 50 or so days of the year. This is circled in yellow. Typically this is around the third week of February.
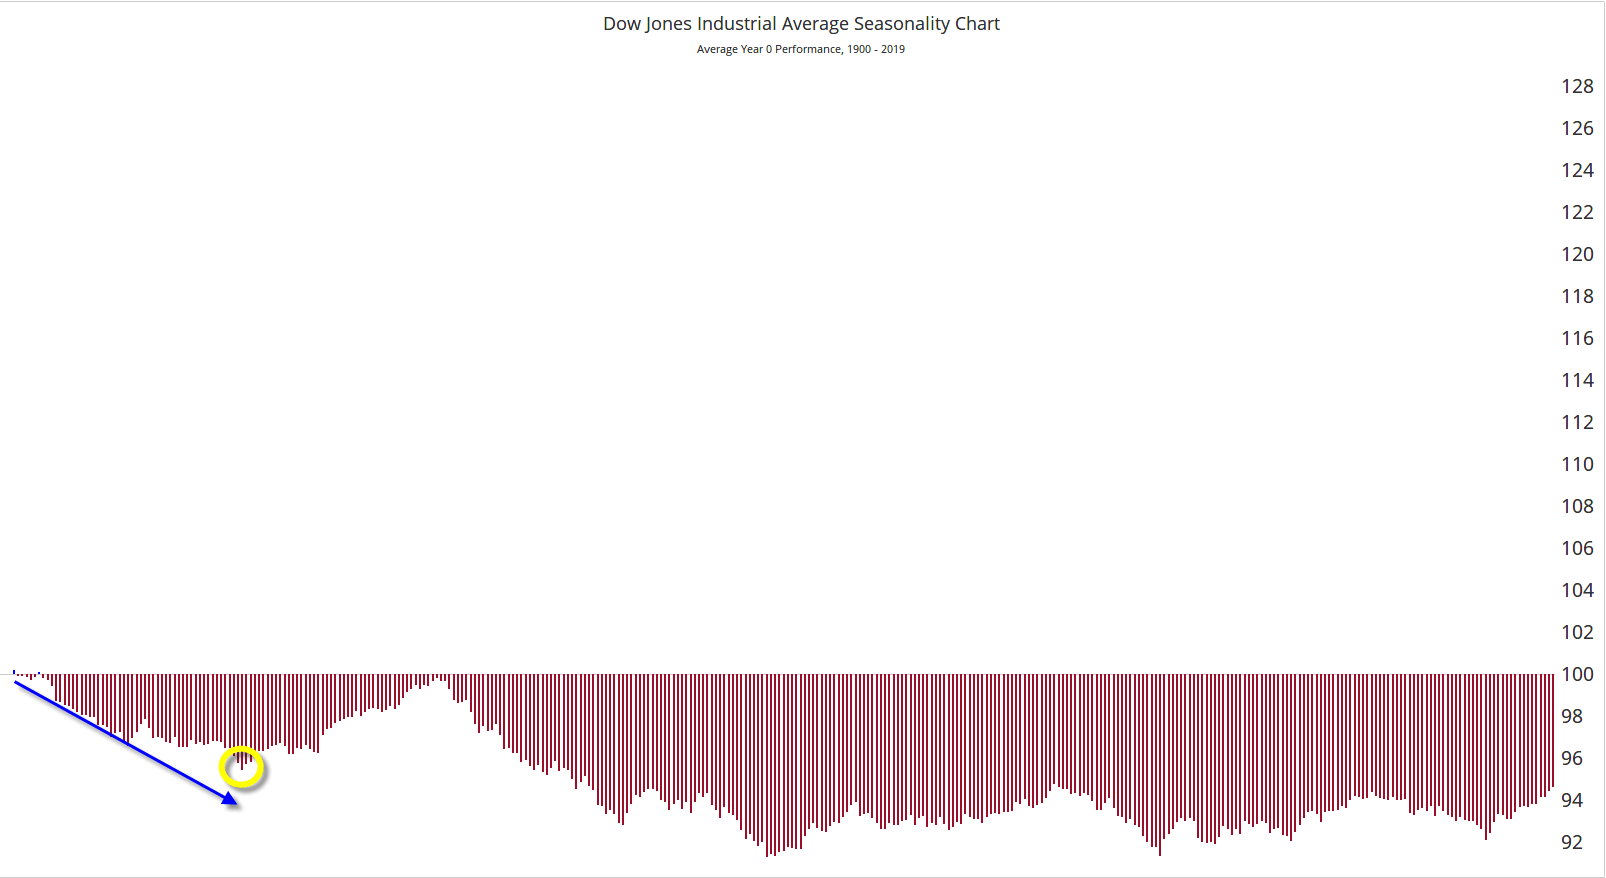
Our research also shows that several of the years ending in 0 bringing major highs during the first two to three weeks of the month of January.
These are just a very small number of the insights that we have in our Market Timing Report Year Ahead Special Edition.
Putting these cycles together does suggest we are in for a rollercoaster ride during this year. The war cycle index is approaching a significant high.
Markets are at extremes.
In 2020 I believe we can expect the unexpected.
This article belongs to the 20 trading ideas for 2020 series. Check the full list of 2020 pieces.
Author

Andrew Pancholi
Market Timing Report
Andrew Pancholi is a world-renowned trading expert specializing in market timing.


