WTI Price Analysis: Steadies around $72.50 after OPEC’s normalizing Oil supply policy-indued losses
- The Oil price finds support near $72.50 after falling consecutively for five trading session.
- The OPEC+ would pause rollback of production cuts if demand appears to remain relatively weak.
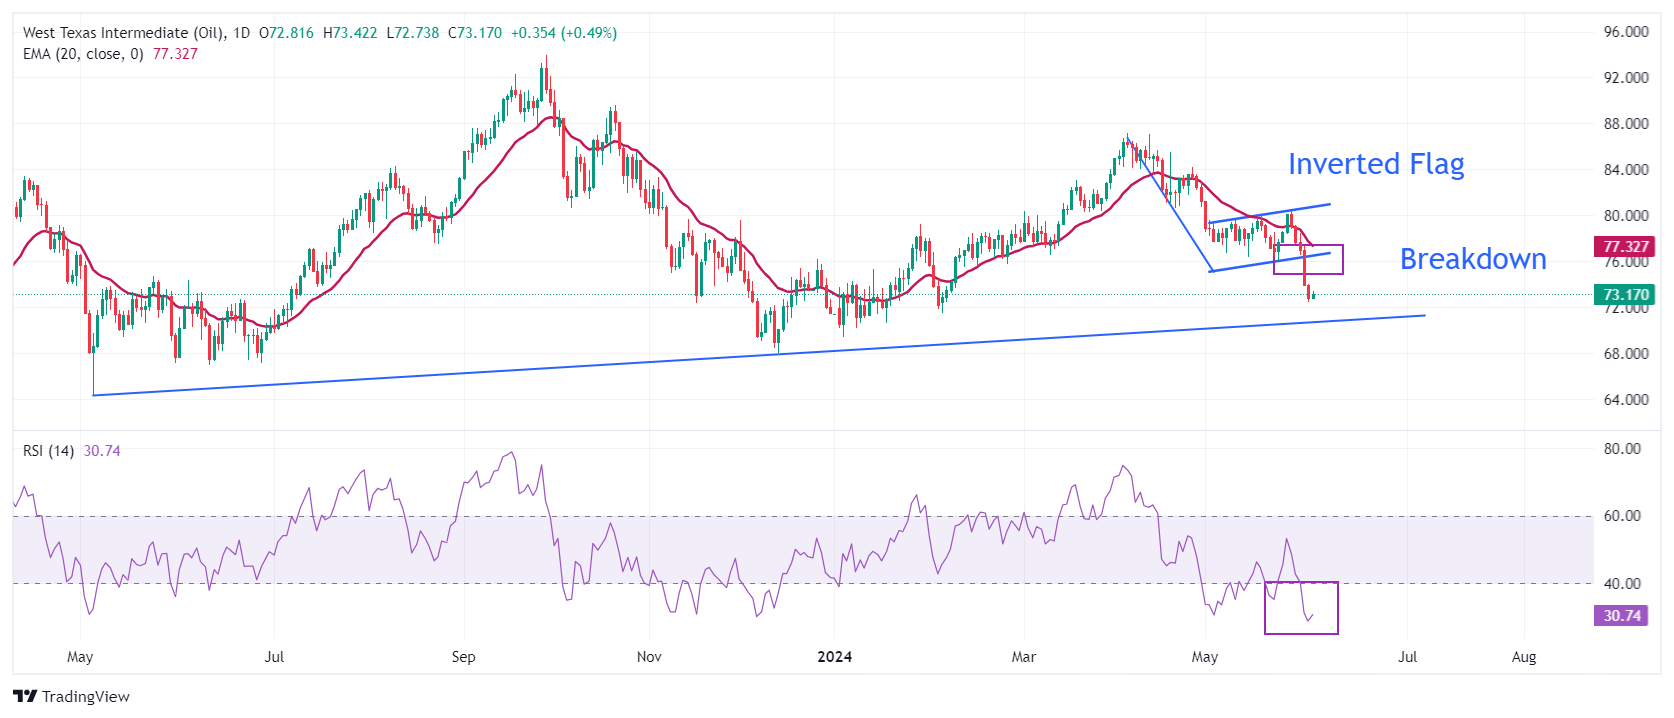
- WTI shifts into the bearish trajectory after an Inverted Flag breakdown.

West Texas Intermediate (WTI), futures on NYMEX, find a temporary cushion near $72.50 in Wednesday’s European session. The Oil price remains offered for an entire week due to deepening demand concerns and OPEC’s communication to shore up the market with more supply.
The OPEC’s meeting on June 2 indicated a decline in production cuts by 2.2 million barrels per day (bpd) from September this year. Excess supply of Oil negatively influences its price. However, Saudi Arabia's energy minister, Prince Abdulaziz bin Salman, has said OPEC+ would pause the unwinding of the cuts or reverse them if demand wasn't strong enough to absorb the barrels, Reuters reported.
Meanwhile, investors shift focus to the United States (US) Nonfarm Payrolls (NFP) data for May that will provide cues about when the Federal Reserve (Fed) will start reducing interest rates. The situation of Fed maintaining a restrictive interest rate framework for a longer period weigh on the Oil price as it negatively influences its demand outlook.
The US Dollar Index (DXY), which tracks the US Dollar’s value against six major currencies, steadies above 104.00. In today’s session, investors will focus on the US ISM Services PMI and ADP Employment Change data for May.
WTI weakens after a breakdown of the Inverted Flag chart pattern formed on a daily timeframe. The Inverted Flag formation reflects an inventory adjustment process that follows the ongoing trend after the completion, which in this case is down.
Declining 20-day Exponential Moving Average (EMA) near $77.35 suggests that the near-term outlook is vulnerable.
The 14-period Relative Strength Index (RSI) shifts into the bearish range of 20.00-40.00, indicating that momentum has leaned towards the downside.
Going forward, the upward-sloping trendline marked from 4 May 2023 low near $64.30 will act as major support for the Oil price bulls.
As the overall trend of the Oil price is bearish, investors should look for sell-at-rise opportunity to build fresh shorts. A pullback move to near June 4 high around $74.00 should be used as a selling opportunity for targets of February 5 low at $71.46 and the psychological support of $70.00.
WTI daily chart
Author

Sagar Dua
FXStreet
Sagar Dua is associated with the financial markets from his college days. Along with pursuing post-graduation in Commerce in 2014, he started his markets training with chart analysis.


