USD/JPY Price Analysis: Trades close to seven-week high near 158.00


  • USD/JPY rises to a seven-week high near 158.00 amid multiple tailwinds.
  • The US Dollar strengthens as the Fed maintains hawkish guidance on interest rates.
  • The Japanese Yen weakens as BoJ pushes plans for a reduction in bond-buying operations.

The USD/JPY pair jumps to near 158.00 in Monday’s American session. The asset extends its upside as Federal Reserve’s (Fed) hawkish narrative on the interest rate outlook has strengthened the US Dollar (USD) and the postponement of taper tantrum plans by the Bank of Japan (BoJ) has weakened the Japanese Yen.

The US Dollar Index (DXY), which tracks the Greenback’s value against six major currencies, trades sideways but clings to gains near 105.56. The Fed sees only one rate cut this year as policymakers want to see inflation declining for months.

Meanwhile, investors shifted focus to the United States (US) Retail Sales data for May, which will be published on Tuesday. Monthly Retail Sales are estimated to have increased by 0.3% after remaining flat in April.

The Japanese Yen remains on the backfoot as the BoJ pushes plans of tapering bond-buying operations to the July meeting. BoJ Governor Kazuo Ueda left interest rates unchanged but didn’t rule out expectations for further policy tightening in July.

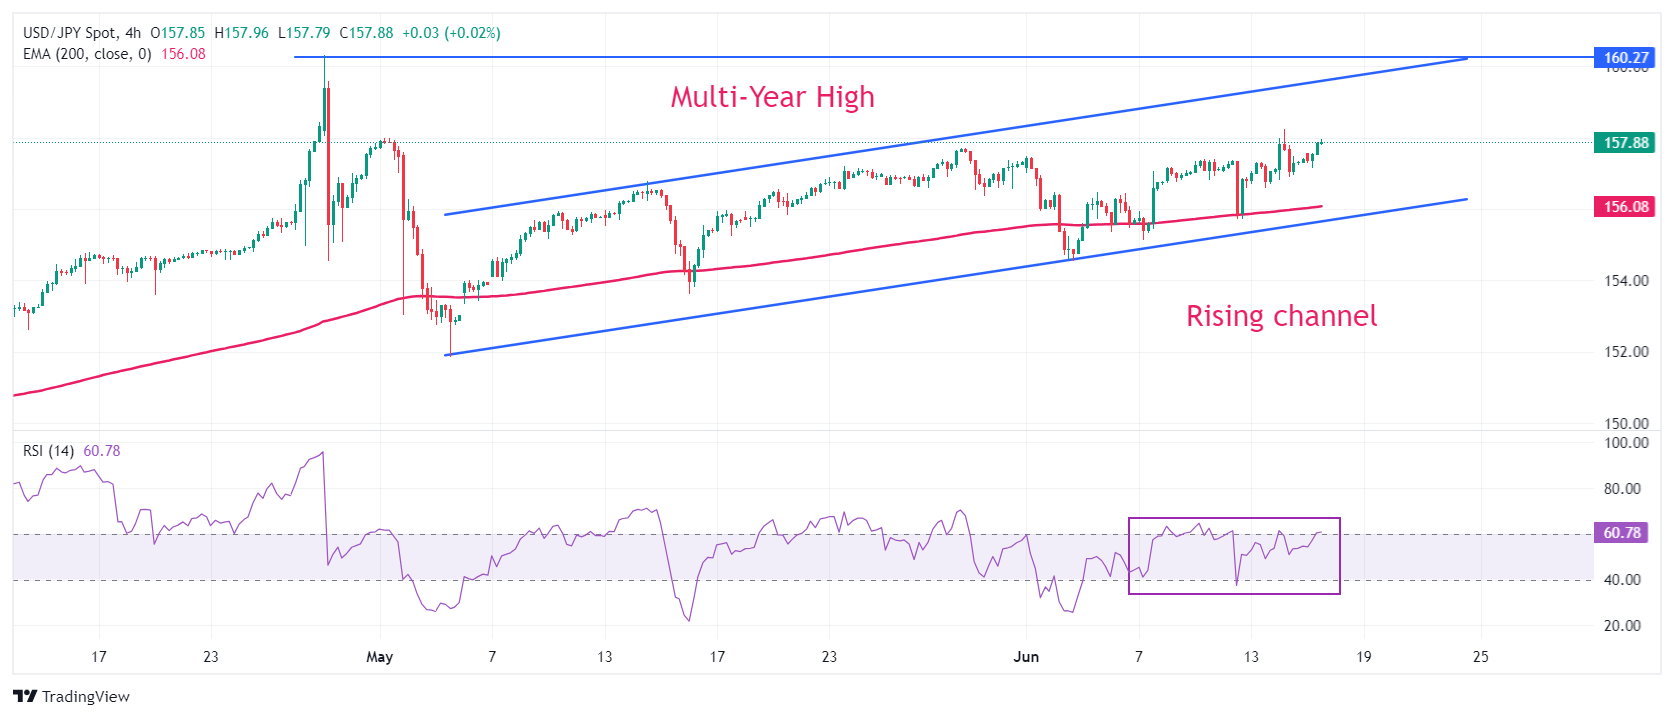
USD/JPY trades in a Rising Channel chart formation on a four-hour timeframe in which each corrective move is considered a buying opportunity by market participants. The asset remains above the 200-period Exponential Moving Average (EMA) near 156.00, suggesting that the overall trend is bullish.

The 14-period Relative Strength Index (RSI) hovers near 60.00. Momentum would lean towards the upside if the oscillator establishes above 60.00.

More upside would appear if the asset breaks above June 14 high at 158.26, which will drive it towards multi-year high of 160.00. Breach of the latter will expose the pair in an unchartered territory.

On the flip side, a breakdown below May 16 low at 153.60 will expose the asst towards May 3 low at 151.86, followed by the psychological support of 150.00.

USD/JPY four-hour chart

USD/JPY

Overview
Today last price 157.88
Today Daily Change 0.49
Today Daily Change % 0.31
Today daily open 157.39
 
Trends
Daily SMA20 156.68
Daily SMA50 155.56
Daily SMA100 152.66
Daily SMA200 150.07
 
Levels
Previous Daily High 158.26
Previous Daily Low 156.81
Previous Weekly High 158.26
Previous Weekly Low 155.72
Previous Monthly High 157.99
Previous Monthly Low 151.86
Daily Fibonacci 38.2% 157.7
Daily Fibonacci 61.8% 157.36
Daily Pivot Point S1 156.71
Daily Pivot Point S2 156.04
Daily Pivot Point S3 155.27
Daily Pivot Point R1 158.16
Daily Pivot Point R2 158.93
Daily Pivot Point R3 159.6


Share: Feed news

Information on these pages contains forward-looking statements that involve risks and uncertainties. Markets and instruments profiled on this page are for informational purposes only and should not in any way come across as a recommendation to buy or sell in these assets. You should do your own thorough research before making any investment decisions. FXStreet does not in any way guarantee that this information is free from mistakes, errors, or material misstatements. It also does not guarantee that this information is of a timely nature. Investing in Open Markets involves a great deal of risk, including the loss of all or a portion of your investment, as well as emotional distress. All risks, losses and costs associated with investing, including total loss of principal, are your responsibility. The views and opinions expressed in this article are those of the authors and do not necessarily reflect the official policy or position of FXStreet nor its advertisers. The author will not be held responsible for information that is found at the end of links posted on this page.

If not otherwise explicitly mentioned in the body of the article, at the time of writing, the author has no position in any stock mentioned in this article and no business relationship with any company mentioned. The author has not received compensation for writing this article, other than from FXStreet.

FXStreet and the author do not provide personalized recommendations. The author makes no representations as to the accuracy, completeness, or suitability of this information. FXStreet and the author will not be liable for any errors, omissions or any losses, injuries or damages arising from this information and its display or use. Errors and omissions excepted.

The author and FXStreet are not registered investment advisors and nothing in this article is intended to be investment advice.

XM
Account
7.2
Tools
9.2
Service
9.4
Trading
9.0
Trust
7.0
Experience
8.4
Read review
Moneta Markets
Account
7.4
Tools
6.6
Service
8.0
Trading
6.6
Trust
5.2
Experience
9.2
Read review
Trading Pro
Account
7.2
Tools
5.2
Service
6.6
Trading
8.0
Trust
5.0
Experience
7.0
Read review
Pepperstone
Account
8.2
Tools
8.2
Service
7.4
Trading
9.0
Trust
8.8
Experience
9.0
Read review
XM
Read review
Moneta Markets
Read review
Trading Pro
Read review
Pepperstone
Read review
Trading Pro
Read review
Pepperstone
Read review
XM
Read review
Moneta Markets
Read review
Trading Pro
Account
7.2
Tools
5.2
Service
6.6
Trading
8.0
Trust
5.0
Experience
7.0
Read review
Pepperstone
Account
8.2
Tools
8.2
Service
7.4
Trading
9.0
Trust
8.8
Experience
9.0
Read review
XM
Account
7.2
Tools
9.2
Service
9.4
Trading
9.0
Trust
7.0
Experience
8.4
Read review
Moneta Markets
Account
7.4
Tools
6.6
Service
8.0
Trading
6.6
Trust
5.2
Experience
9.2
Read review

Recommended content


Recommended content

Editors’ Picks

Gold hovers around all-time highs near $3,250

Gold hovers around all-time highs near $3,250


Gold is holding steady near the $3,250 mark, fuelled by robust safe-haven demand, trade war concerns, and a softer-than-expected US inflation gauge. The US Dollar keeps trading with heavy losses around three-year lows.

Gold News
EUR/USD retreats towards 1.1300 as Wall Street shrugs off trade war headlines

EUR/USD retreats towards 1.1300 as Wall Street shrugs off trade war headlines

The EUR/USD pair retreated further from its recent multi-month peak at 1.1473 and trades around the 1.1300 mark. Wall Street manages to advance ahead of the weekly close, despite escalating tensions between Washington and Beijing and mounting fears of a US recession. Profit-taking ahead of the close also weighs on the pair. 

EUR/USD News
GBP/USD trims gains, recedes to the 1.3050 zone

GBP/USD trims gains, recedes to the 1.3050 zone

GBP/USD now gives away part of the earlier advance to fresh highs near 1.3150. Meanwhile, the US Dollar remains offered amid escalating China-US trade tensions, recession fears in the US, and softer-than-expected US Producer Price data.

GBP/USD News
Bitcoin, Ethereum, Dogecoin and Cardano stabilze –  Why crypto is in limbo

Bitcoin, Ethereum, Dogecoin and Cardano stabilze –  Why crypto is in limbo

Bitcoin, Ethereum, Dogecoin and Cardano stabilize on Friday as crypto market capitalization steadies around $2.69 trillion. Crypto traders are recovering from the swing in token prices and the Monday bloodbath. 

Read more
Is a recession looming?

Is a recession looming?

Wall Street skyrockets after Trump announces tariff delay. But gains remain limited as Trade War with China continues. Recession odds have eased, but investors remain fearful. The worst may not be over, deeper market wounds still possible.

Read more
The Best brokers to trade EUR/USD

The Best brokers to trade EUR/USD

SPONSORED Discover the top brokers for trading EUR/USD in 2025. Our list features brokers with competitive spreads, fast execution, and powerful platforms. Whether you're a beginner or an expert, find the right partner to navigate the dynamic Forex market.

Read More

Forex MAJORS

Cryptocurrencies

Signatures

Best Brokers of 2025