|

USD/JPY Price Analysis: Shies from 160.00 as Japan’s intervention fears intensify

  • USD/JPY faces pressure in an attempt to recapture 160.00 as fears of Japan’s intervention deepen.
  • The BoJ looks to raise interest rates further as weak Yen continues to boost inflationary pressures.
  • The US Dollar will be guided by the US core PCE inflation data for May.

The USD/JPY pair exhibits a subdued performance slightly below the psychological resistance of 160.00 in Tuesday’s European session. The rally in the asset appears to have stalled as investors expect a stealth intervention by Japan’s authority against excessive FX moves to limit the downside in the Japanese Yen.

Fears of Japan’s intervention in the FX domain intensified after country’s main currency diplomat Masato Kanda said on Monday that the government would intervene around the clock if necessary.

Also, expectations for the Bank of Japan (BoJ) to tighten policy further have improved as weak Yen is resulting in higher inflation by making exports competitive in global markets and increasing import costs. The BoJ minutes for the latest meeting showed that one member advocated for an increase "without too much delay" to help bring inflation back down, Reuters reported.

Meanwhile, the US Dollar (USD) struggles to gain ground as investors expect that the Federal Reserve (Fed) will deliver two rate cuts this year and will choose the September meeting to begin the policy-normalization process. This week, the major trigger for the US Dollar will be the United States (US) core Personal Consumption Expenditure price index (PCE) for May, which will be published on Friday.

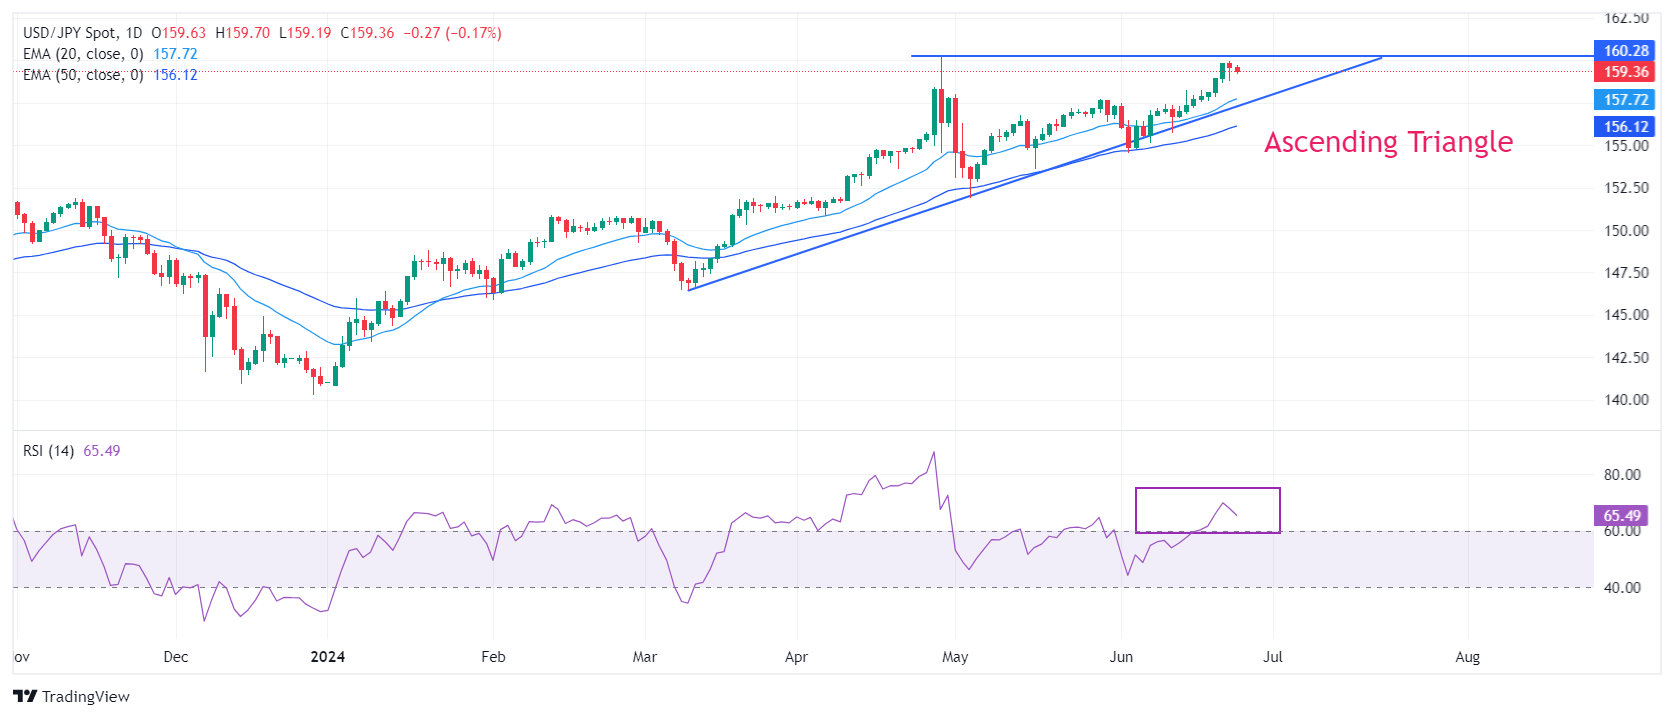
USD/JPY hovers near the horizontal resistance of the Ascending Triangle chart formation on a daily timeframe, which is plotted from April 29 high of 160.32. The upward-sloping border of the above-mentioned chart pattern is placed from March 11 low near 146.50.

Advancing 20- and 50-day Exponential Moving Averages (EMAs) near 157.70 and 156.10, respectively, indicate that the overall trend is bullish.

The 14-day Relative Strength Index (RSI) oscillates inside the 60.00-80.00 range, suggesting that momentum is already in favor of bulls.

More upside would appear if the asset breaks above multi-year high of 160.00. Breach of the latter will expose the pair in unchartered territory towards 162.00

On the flip side, a breakdown below May 16 low at 153.60 will expose the asst towards May 3 low at 151.86, followed by the psychological support of 150.00.

USD/JPY daily chart

USD/JPY

Overview
Today last price159.35
Today Daily Change-0.28
Today Daily Change %-0.18
Today daily open159.63
 
Trends
Daily SMA20157.29
Daily SMA50156.25
Daily SMA100153.33
Daily SMA200150.41
 
Levels
Previous Daily High159.93
Previous Daily Low158.75
Previous Weekly High159.84
Previous Weekly Low157.16
Previous Monthly High157.99
Previous Monthly Low151.86
Daily Fibonacci 38.2%159.2
Daily Fibonacci 61.8%159.48
Daily Pivot Point S1158.94
Daily Pivot Point S2158.25
Daily Pivot Point S3157.76
Daily Pivot Point R1160.12
Daily Pivot Point R2160.62
Daily Pivot Point R3161.31

Author

Sagar Dua

Sagar Dua

FXStreet

Sagar Dua is associated with the financial markets from his college days. Along with pursuing post-graduation in Commerce in 2014, he started his markets training with chart analysis.

More from Sagar Dua
Share:

Editor's Picks

GBP/USD bounces off lows, back above 1.3200

After bottoming out near 1.3160, GBP/USD manages to regain a bit of shine and reclaim the 1.3200 mark and beyond at the end of the week. Stronger-than-expected UK Retail Sales data seem to be helping the British Pound limit its losses, while the chaotic UK political environment keeps the bulls at bay for now.

EUR/USD looks consolidative around 1.1460

EUR/USD stages a modest rebound after slipping to a three-month low below 1.1420 at the end of the week. That said, the pair now looks to consolidate humble gains just above 1.1460 despite growing uncertainty surrounding the next round of US-Iran negotiations, which keeps the US Dollar’s downside contained.

Gold slips back to six-day lows, targets $4,100

Gold retreats for the third consecutive day on Friday, eroding gains seen in the first half of the week and approaching the key $4,100 mark per troy ounce. Indeed, the precious metal continues to face headwinds from the Fed's hawkish stance and renewed uncertainty surrounding the next round of US-Iran negotiations.

Breaking: Iran closes the Strait of Hormuz amid ceasefire deal violation
Iran says it is closing the Strait of Hormuz after accusing the United States (US) and Israel of violating the ceasefire. According to Iran, the decision came over the continued Israeli strikes in Lebanon. The Iranian Revolutionary Guard Corps Navy issued a warning to all vessels: "Do not approach the Strait of Hormuz; otherwise, your security will be jeopardized."
The Iran war didn't break the US economy, but what happens next?

Nearly four months after the start of the Iran war, the US economy remains remarkably resilient. While the conflict initially triggered a severe disruption to global energy markets and a sharp rise in Oil prices, recent diplomatic progress between Washington and Tehran has eased concerns about a prolonged supply shock.

Regime change: Inside Kevin Warsh's first move to make the Fed unreadable on purpose

The rate did not move. That was the least interesting thing about Kevin Warsh's first meeting in charge of the Fed. The FOMC held its benchmark at 3.50%-3.75% for the fourth straight meeting, exactly as priced, and then the new chair used his first press conference to dismantle the machinery the market has leaned on for a decade.