USD/INR holds positive ground ahead of Indian CPI, US PPI data
- The Indian Rupee weakens in Friday’s European session.
- The renewed demand for US Dollar and recovery of crude oil prices undermine the INR.
- India’s Consumer Price Index (CPI) and US Producer Price Index (PPI) for June will be the highlights on Friday.

The Indian Rupee (INR) loses traction on Friday amid the modest recovery of the US Dollar (USD). The demand for the Greenback from state-run banks and local importers limits the INR’s potential gains. Additionally, the rebound of crude oil prices also exerts some selling pressure on the local currency as India is the third largest consumer of crude oil in the world, after the United States and China.
On the other hand, the positive trends in the Indian stock market, sustained foreign inflows, and India’s strong macroeconomic growth might underpin the INR. Also, the rising expectation of the US Federal Reserve (Fed) rate cut in September after the softer US inflation data is likely to weigh on the USD and cap the upside for the USD/INR pair in the near term.
Later on Friday, Investors will keep an eye on the Indian Consumer Price Index (CPI) data, which is expected to show an increase of 4.8% in June. Also, the Industrial Production and Manufacturing Output will be released. On the US docket, the US June Producer Price Index (PPI) and the preliminary July Michigan Consumer Sentiment gauge will be published.
Daily Digest Market Movers: Indian Rupee remains sensitive to global factors
- The International Monetary Fund (IMF) estimates that shifting employment into construction, services, and manufacturing might boost India's GDP growth by 0.2 to 0.5 percentage points.
- The US Consumer Price Index (CPI) rose 3.0% on a yearly basis in June, compared to a rise of 3.3% in May. This reading came in below the market consensus of 3.1%, according to the US Bureau of Labor Statistics (BLS) on Thursday. On a monthly basis, the CPI declined 0.1% MoM in June, the lowest level in more than three years.
- The annual core CPI, which excludes volatile food and energy prices, climbed 3.3% YoY in June, below the forecast and May's increase of 3.4%. The figure was up 0.1% on a monthly basis.
- Federal Reserve Bank of Chicago President Austan Goolsbee expressed on Friday that the recent inflation report was “excellent,” adding that the reports provided proof that the central bank is on track to meet its 2% target.
- Federal Reserve Bank of San Francisco President Mary Daly acknowledged improving inflation figures on Thursday. Daly expects further easing in both price pressures and the labor market to warrant interest rate cuts.
- Financial markets saw nearly 85% odds of a Fed rate cut in September, up from the 70% chance seen before the CPI report. Two rate cuts are anticipated this year.
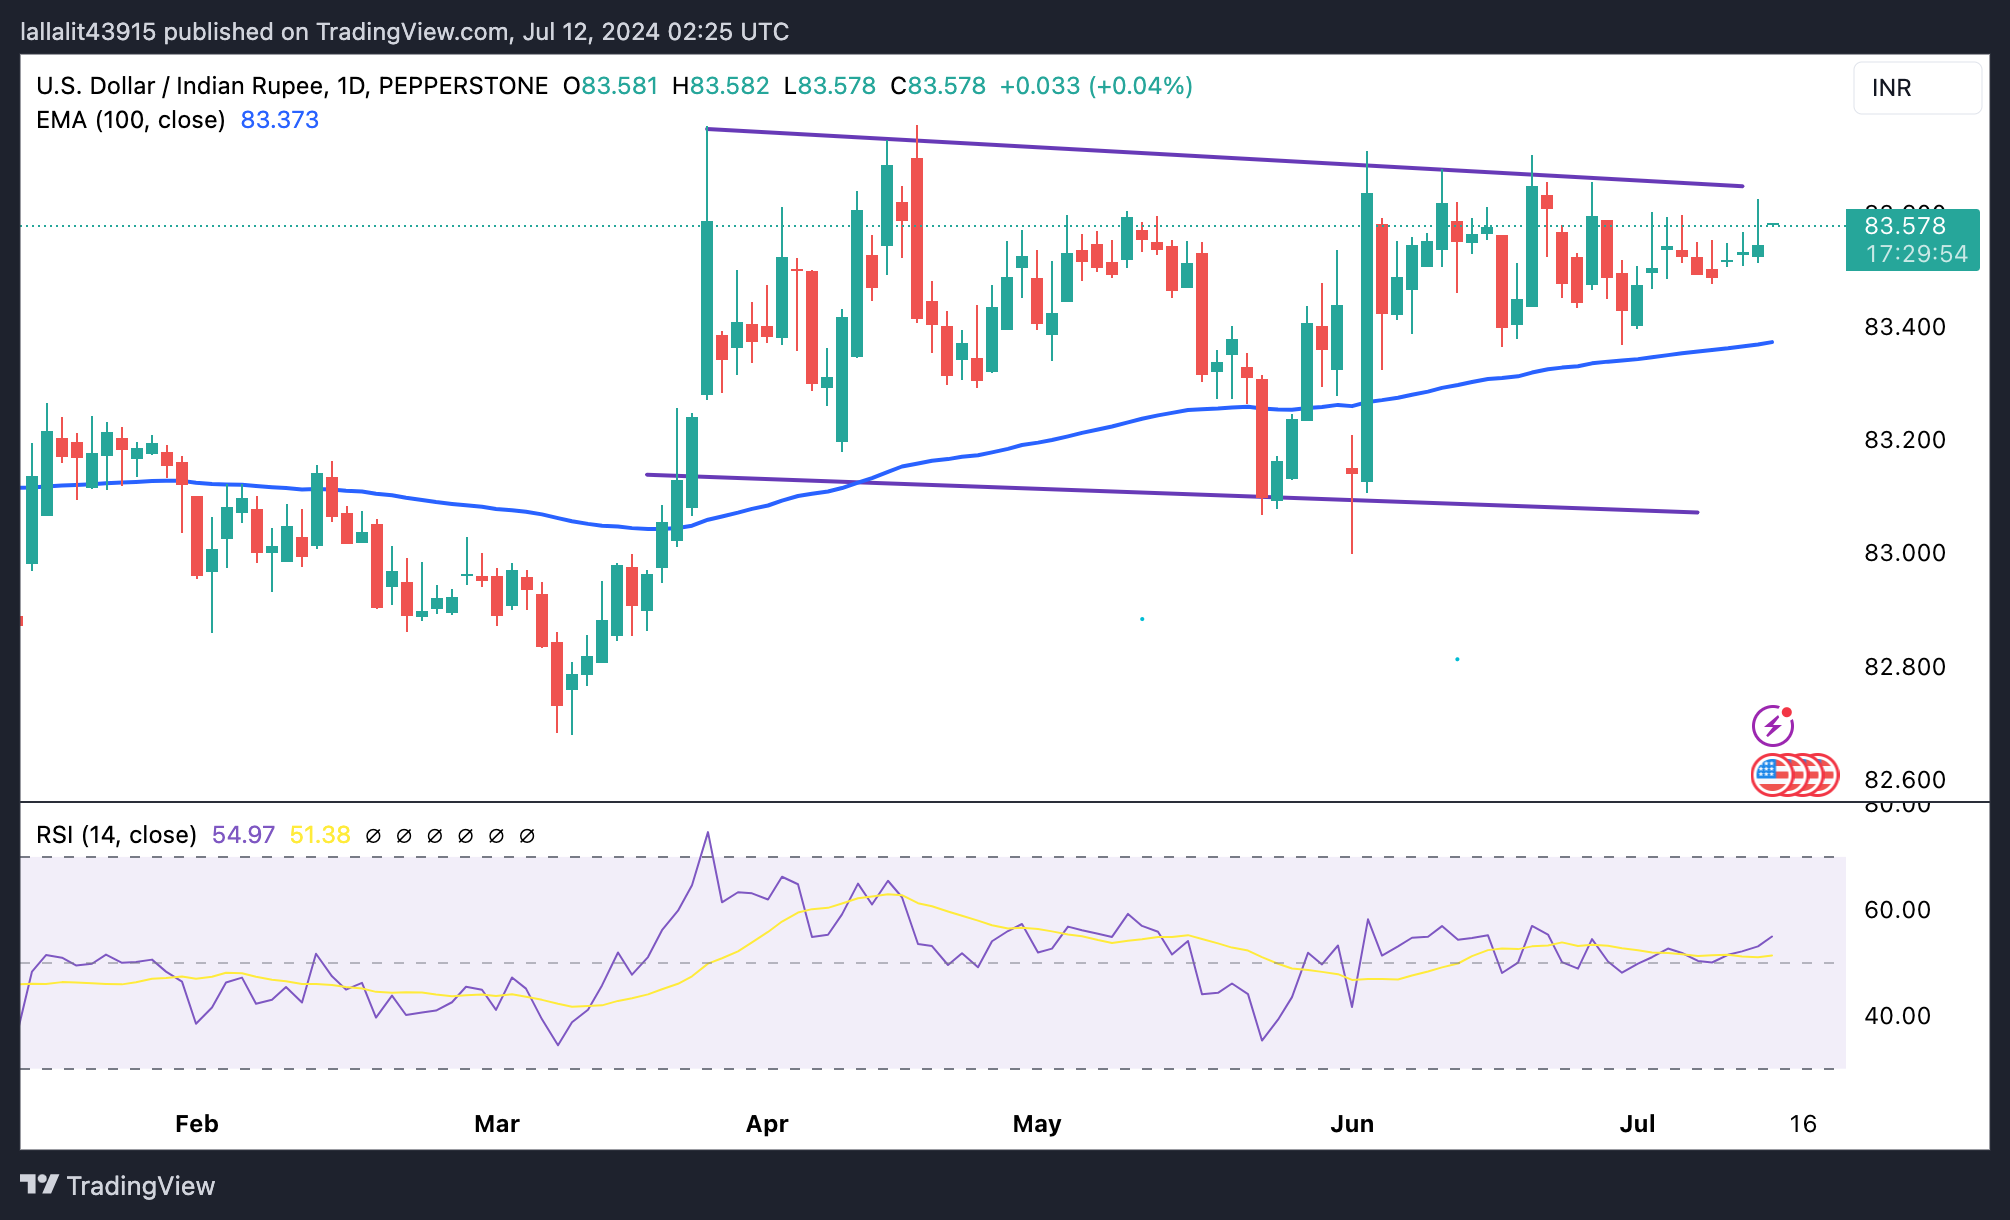
Technical analysis: USD/INR goes into consolidation in the near term
The Indian Rupee trades weaker on the day. According to the daily chart, the USD/INR pair keeps the bullish vibe unchanged above the key 100-day Exponential Moving Average (EMA). The 14-day Relative Strength Index (RSI) holds in bullish territory above the 50-midline, suggesting that the EMA support is likely to hold rather than break. However, in the shorter term, the pair has remained inside its month-long range since March 21.
Any follow-through buying above the upper boundary of the trading range at 83.65 could lead to a retest of the all-time high of 83.75. Extended gains will see a rally to the 84.00 psychological barrier.
Sustained trading below the 100-day EMA at 83.37 could pave the way to the 83.00 round mark. The next downside target is seen at 82.82, a low of January 12.
US Dollar price today
The table below shows the percentage change of US Dollar (USD) against listed major currencies today. US Dollar was the strongest against the Japanese Yen.
| USD | EUR | GBP | CAD | AUD | JPY | NZD | CHF | |
| USD | 0.02% | 0.07% | -0.03% | -0.06% | 0.52% | -0.12% | -0.05% | |
| EUR | -0.02% | 0.02% | -0.05% | -0.03% | 0.44% | -0.12% | -0.08% | |
| GBP | -0.07% | -0.03% | -0.08% | -0.06% | 0.42% | -0.14% | -0.10% | |
| CAD | 0.03% | 0.05% | 0.08% | 0.02% | 0.49% | -0.07% | -0.03% | |
| AUD | 0.06% | 0.03% | 0.05% | -0.02% | 0.46% | -0.09% | -0.05% | |
| JPY | -0.52% | -0.54% | -0.45% | -0.54% | -0.53% | -0.55% | -0.51% | |
| NZD | 0.08% | 0.12% | 0.14% | 0.07% | 0.09% | 0.57% | 0.04% | |
| CHF | 0.04% | 0.08% | 0.10% | 0.03% | 0.05% | 0.50% | -0.04% |
The heat map shows percentage changes of major currencies against each other. The base currency is picked from the left column, while the quote currency is picked from the top row. For example, if you pick the Euro from the left column and move along the horizontal line to the Japanese Yen, the percentage change displayed in the box will represent EUR (base)/JPY (quote).
Indian Rupee FAQs
The Indian Rupee (INR) is one of the most sensitive currencies to external factors. The price of Crude Oil (the country is highly dependent on imported Oil), the value of the US Dollar – most trade is conducted in USD – and the level of foreign investment, are all influential. Direct intervention by the Reserve Bank of India (RBI) in FX markets to keep the exchange rate stable, as well as the level of interest rates set by the RBI, are further major influencing factors on the Rupee.
The Reserve Bank of India (RBI) actively intervenes in forex markets to maintain a stable exchange rate, to help facilitate trade. In addition, the RBI tries to maintain the inflation rate at its 4% target by adjusting interest rates. Higher interest rates usually strengthen the Rupee. This is due to the role of the ‘carry trade’ in which investors borrow in countries with lower interest rates so as to place their money in countries’ offering relatively higher interest rates and profit from the difference.
Macroeconomic factors that influence the value of the Rupee include inflation, interest rates, the economic growth rate (GDP), the balance of trade, and inflows from foreign investment. A higher growth rate can lead to more overseas investment, pushing up demand for the Rupee. A less negative balance of trade will eventually lead to a stronger Rupee. Higher interest rates, especially real rates (interest rates less inflation) are also positive for the Rupee. A risk-on environment can lead to greater inflows of Foreign Direct and Indirect Investment (FDI and FII), which also benefit the Rupee.
Higher inflation, particularly, if it is comparatively higher than India’s peers, is generally negative for the currency as it reflects devaluation through oversupply. Inflation also increases the cost of exports, leading to more Rupees being sold to purchase foreign imports, which is Rupee-negative. At the same time, higher inflation usually leads to the Reserve Bank of India (RBI) raising interest rates and this can be positive for the Rupee, due to increased demand from international investors. The opposite effect is true of lower inflation.
Author

Lallalit Srijandorn
FXStreet
Lallalit Srijandorn is a Parisian at heart. She has lived in France since 2019 and now becomes a digital entrepreneur based in Paris and Bangkok.


