USD/CHF Price Forecast: Steadies below 0.8500 in countdown to US data
- USD/CHF remains on the backfoot near 0.8450 amid weakness in the US Dollar.
- Investors await the US ADP Employment and ISM Services PMI for August.
- A further slowdown in Swiss inflation boosts expectations of SNB’s more rate cuts.
The USD/CHF pair exhibits a subdued performance near 0.8450 in Thursday’s European session. The Swiss Franc asset remains under pressure as the US Dollar (USD) extends its downside after weak United States (US) JOLTS Job Openings data for July raised red flags on current labor market conditions.
The US Dollar Index (DXY), which tracks the Greenback’s value against six major currencies, slides further below 101.20.
Meanwhile, investors await the US ADP Employment and ISM Services PMI data for August to get fresh cues about the potential Federal Reserve (Fed) interest rate cut size this month. The Fed is widely anticipated to start reducing interest rates in the September meeting but traders remain split over the magnitude of the interest rate cut.
In the Swiss region, consistently easing inflationary pressures have prompted expectations that the Swiss National Bank (SNB) will soften its monetary policy for the third time in a row this month. The SNB has reduced its key borrowing rates by 50 basis points (bps) this year to 1.25%.
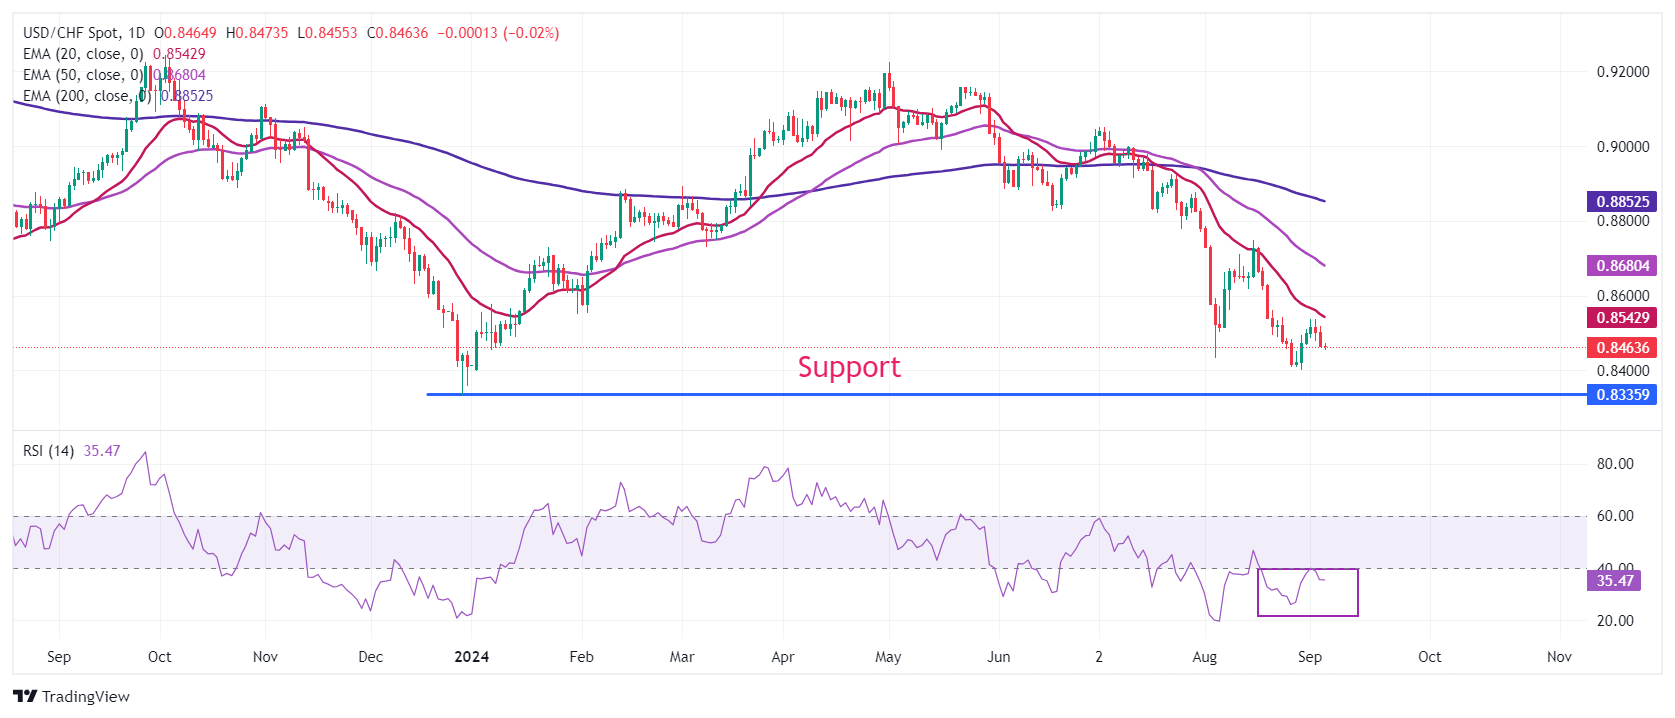
USD/CHF declines toward the horizontal support plotted from 28 December 2023 low of 0.8333 on a daily timeframe. The near-term and broader-term outlooks of the Swiss Franc asset remain bearish as all short-to-long-term Exponential Moving Averages (EMAs) are declining.
The 14-day Relative Strength Index (RSI) oscillates in the bearish range of 20.00-40.00, suggesting that a strong bearish momentum is intact.
More downside would appear if the asset breaks below August 5 low of 0.8432, which would drag the major towards the round-level support of 0.8400 and 28 December 2023 low of 0.8333.
On the flip side, a recovery move above the weekly high near 0.8540 will drive the asset toward the round-level resistance of 0.8600, followed by August 20 high of 0.8632.
USD/CHF daily chart
US Dollar PRICE Today
The table below shows the percentage change of US Dollar (USD) against listed major currencies today. US Dollar was the strongest against the Canadian Dollar.
| USD | EUR | GBP | JPY | CAD | AUD | NZD | CHF | |
|---|---|---|---|---|---|---|---|---|
| USD | -0.15% | -0.15% | -0.19% | 0.04% | 0.00% | -0.16% | -0.02% | |
| EUR | 0.15% | 0.01% | -0.02% | 0.24% | 0.16% | 0.03% | 0.13% | |
| GBP | 0.15% | -0.01% | -0.02% | 0.21% | 0.14% | 0.04% | 0.11% | |
| JPY | 0.19% | 0.02% | 0.02% | 0.22% | 0.18% | 0.01% | 0.16% | |
| CAD | -0.04% | -0.24% | -0.21% | -0.22% | -0.03% | -0.19% | -0.07% | |
| AUD | -0.01% | -0.16% | -0.14% | -0.18% | 0.03% | -0.15% | -0.03% | |
| NZD | 0.16% | -0.03% | -0.04% | -0.01% | 0.19% | 0.15% | 0.11% | |
| CHF | 0.02% | -0.13% | -0.11% | -0.16% | 0.07% | 0.03% | -0.11% |
The heat map shows percentage changes of major currencies against each other. The base currency is picked from the left column, while the quote currency is picked from the top row. For example, if you pick the US Dollar from the left column and move along the horizontal line to the Japanese Yen, the percentage change displayed in the box will represent USD (base)/JPY (quote).
Author

Sagar Dua
FXStreet
Sagar Dua is associated with the financial markets from his college days. Along with pursuing post-graduation in Commerce in 2014, he started his markets training with chart analysis.


