USD/CHF Price Analysis: Wobbles inside falling wedge on 1H
- USD/CHF seesaws around two-month low inside a bullish chart pattern.
- Oversold RSI conditions suggest another move up to break 200-hour EMA.

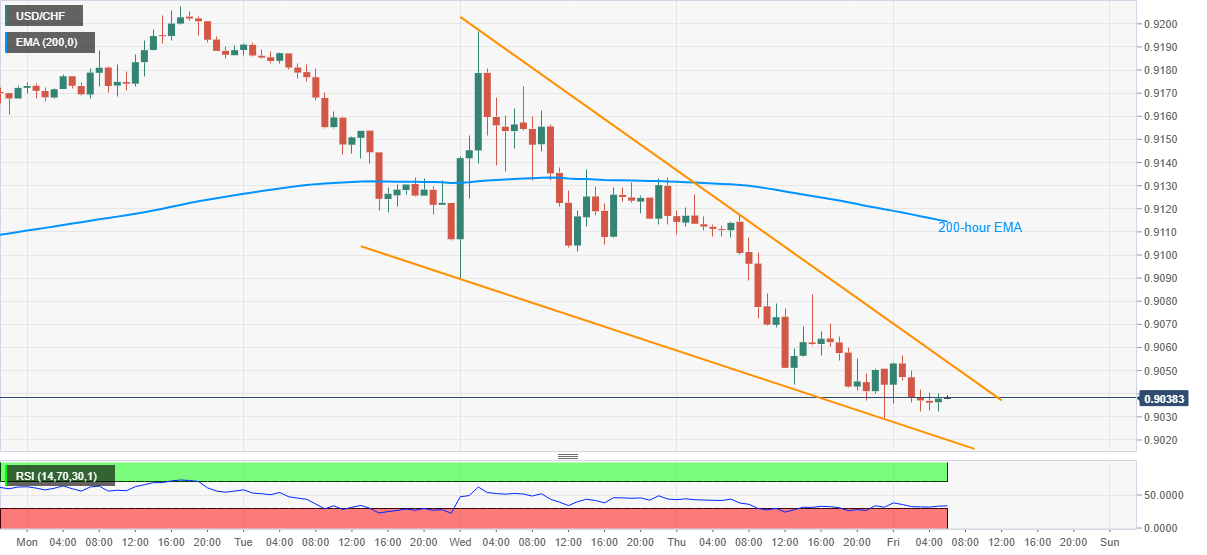
Having marked a downtick below October 21 bottom to test the September-start low, USD/CHF wavers near 0.9038, down 0.07% intraday, while heading into Friday’s European open.
In doing so, the Swiss pair keeps the two-day-long falling wedge chart formation on the hourly (1H) chart amid the oversold RSI conditions.
As a result, USD/CHF buyers look to confirm the bullish chart play with a sustained break above 0.9055 immediate resistance, which in turn can probe a 200-hour EMA level of 0.9115.
It should, however, be noted that a sustained rise past-0.9115 will not hesitate to challenge the monthly peak surrounding 0.9210.
On the contrary, the formation’s support line around 0.9020 and the 0.9000 threshold can keep pleasing the USD/CHF bears if managed to ignore the RSI conditions.
USD/CHF hourly chart
Trend: Pullback expected
Author

Anil Panchal
FXStreet
Anil Panchal has nearly 15 years of experience in tracking financial markets. With a keen interest in macroeconomics, Anil aptly tracks global news/updates and stays well-informed about the global financial moves and their implications.


