|

USD/CHF Price Analysis: Bounces back strongly from 0.8900 ahead of SNB’s policy

  • USD/CHF surges to near 0.8930 amid uncertainty over SNB’s policy decision.
  • The SNB worries about price pressures reaccelerating due to the weak Swiss Franc.
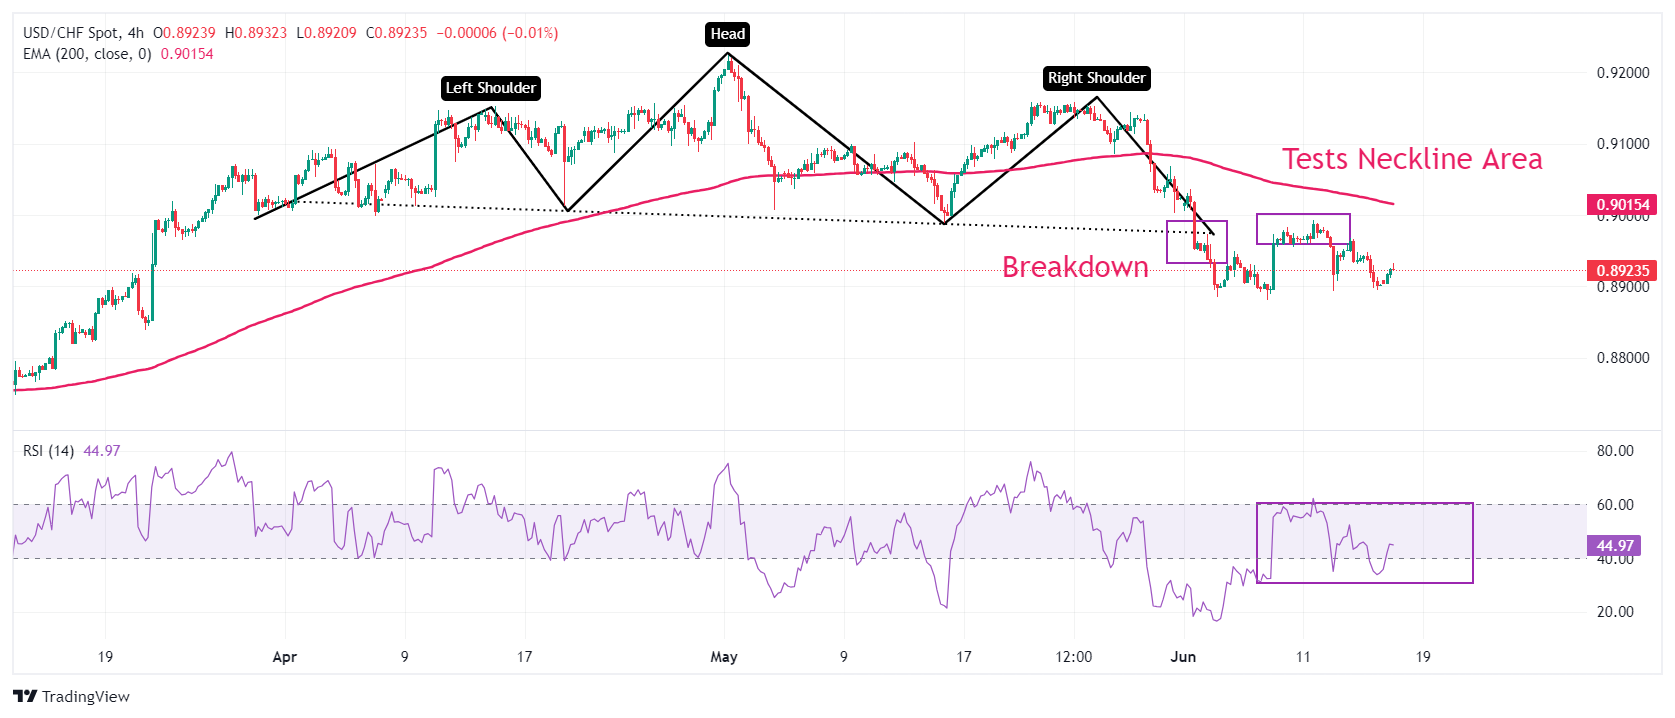
  • USD/CHF tests the breakdown region of the H&S pattern.

The USD/CHF pair recovers strongly from the round-level support of 0.8900 and jumps to near 0.8930 in Monday’s early New York session. The Swiss Franc asset strengthens as US Dollar (USD) clings to gains and the uncertainty over the Swiss National Bank’s (SNB) policy outcome.

Market sentiment appears to be cautious as Federal Reserve (Fed) policymakers continue to support only one rate cut this year as they want to see signs of disinflation for months. Contrary to that, the CME FedWatch tool shows the possibility of two rate cuts, which has been prompted by a higher-than-expected decline in the consumer and producer inflation readings for May.

The US Dollar Index (DXY) holds gains near 105.50. 10-year US Treasury yields soar to 4.27%.

Meanwhile, the Swiss Franc declines ahead of the SNB’s policy’s decision on Thursday. Investors see a close call this time as policymakers remain concerned over the inflation outlook. Weak Swiss Franc have made exports competitive and a sharp rise in import costs have deepened fears of price pressures reaccelerating again. However, year-on-year Swiss inflation has remained comfortably below the 2% threshold since June 2023.

USD/CHF declines after facing selling pressure near the neckline of the Head and Shoulder (H&S) chart pattern formed on a four-hour timeframe. A breakdown of the H&S chart formation results in a bearish reversal. The asset has established below the 200-period Exponential Moving Average (EMA) near 0.9015, which indicates that the overall trend is bearish.

The 14-period Relative Strength Index (RSI) hovers near 40.00. A decisive break below the same would trigger a bearish momentum.

Going forward, more recovery above the psychological resistance of 0.9000 will drive the asset towards June 3 high at 0.9036, followed by May 28 low at 0.9086.

On the flip side, room for more downside towards March 21 low at 0.8840 and the round-level support of 0.8800 will open if the asset breaks below June 4 low of 0.8900.

USD/CHF four-hour chart

USD/CHF

Overview
Today last price0.8923
Today Daily Change0.0021
Today Daily Change %0.24
Today daily open0.8902
 
Trends
Daily SMA200.9025
Daily SMA500.907
Daily SMA1000.8954
Daily SMA2000.8893
 
Levels
Previous Daily High0.8948
Previous Daily Low0.8895
Previous Weekly High0.8993
Previous Weekly Low0.8893
Previous Monthly High0.9225
Previous Monthly Low0.8988
Daily Fibonacci 38.2%0.8915
Daily Fibonacci 61.8%0.8928
Daily Pivot Point S10.8882
Daily Pivot Point S20.8862
Daily Pivot Point S30.8829
Daily Pivot Point R10.8935
Daily Pivot Point R20.8968
Daily Pivot Point R30.8989

Author

Sagar Dua

Sagar Dua

FXStreet

Sagar Dua is associated with the financial markets from his college days. Along with pursuing post-graduation in Commerce in 2014, he started his markets training with chart analysis.

More from Sagar Dua
Share:

Markets move fast. We move first.

Orange Juice Newsletter brings you expert driven insights - not headlines. Every day on your inbox.

By subscribing you agree to our Terms and conditions.

Editor's Picks

EUR/USD bears await break below 100-day SMA support near 1.1665 area

The EUR/USD pair attracts heavy selling for the second straight day and dives to a nearly four-week trough, around the 1.1670 region, during the Asian session on Monday. Bearish traders now await a sustained break below the 100-day Simple Moving Average before positioning for an extension of the recent pullback from a three-month top, or levels just above the 1.1800 mark touched on December 24.

GBP/USD falls toward 1.3400 near 50-day EMA

GBP/USD extends its losses for the second successive session, trading around 1.3420 during the Asian hours on Monday. The technical analysis of the daily chart indicates that the 14-day Relative Strength Index at 53 has eased from near overbought, indicating that momentum has cooled while remaining above the midline. RSI holds above 50, keeping a modest bullish bias.

Gold on fire at the start of the week on US-Venezuela tensions

Gold regains upside traction early Monday as flight to safety prevails on Venezuela turmoil. The US Dollar finds strong haven demand, caps Gold’s upside as focus shifts to US jobs data. Gold’s daily technical setup suggests that more upside remains in the offing.

Bulls firmly in control as Bitcoin breaks $93K, Ethereum and Ripple extend gains

Bitcoin, Ethereum, and Ripple extended their rallies on Monday, gaining more than 4%, 6%, and 12%, respectively, in the previous week. The top three cryptocurrencies by market capitalization could continue to outperform, with bulls in control of the momentum.

Economic outlook 2026-2027 in advanced countries: Solidity test

After a year marked by global economic resilience and ending on a note of optimism, 2026 looks promising and could be a year of solid economic performance. In our baseline scenario, we expect most of the supportive factors at work in 2025 to continue to play a role in 2026.

Meme Coins Price Prediction: Dogecoin, Shiba Inu, Pepe rally on Venezuela’s shadow BTC reserve

Meme coins such as Dogecoin, Shiba Inu, and Pepe are leading the cryptocurrency market rally driven by the US cross-border operation to capture Venezuelan President Nicolás Maduro. Dogecoin extends its gain for the fifth consecutive day while SHIB and PEPE take a pause.