|

USD/CHF Price Analysis: Struggles around 200-DMA, six-week-old support amid Russia-led risk-aversion

  • USD/CHF remains pressured around key support line, down for the second consecutive day.
  • Bearish MACD signal, descending RSI line favor sellers.
  • 61.8% Fibonacci retracement guards immediate upside, monthly resistance line is the key.
  • Safe-haven appeals of USD and CHF both trouble pair traders amid geopolitical fears emanating from Russia, Ukraine.

USD/CHF stays on the back foot around 0.9180 while printing the least daily moves among the Group of 10 (G10) currency pairs during early Thursday morning in Europe.

The reason could be linked to the traders’ indecision due to the risk-safe status of the US dollar and Swiss Franc (CHF) both. That said, Russia’s invasion of Ukraine recently bolstered the market’s risk-off mood.

Read: Forex Today: Flight to safety intensifies as Russia unleashes attack on Ukraine

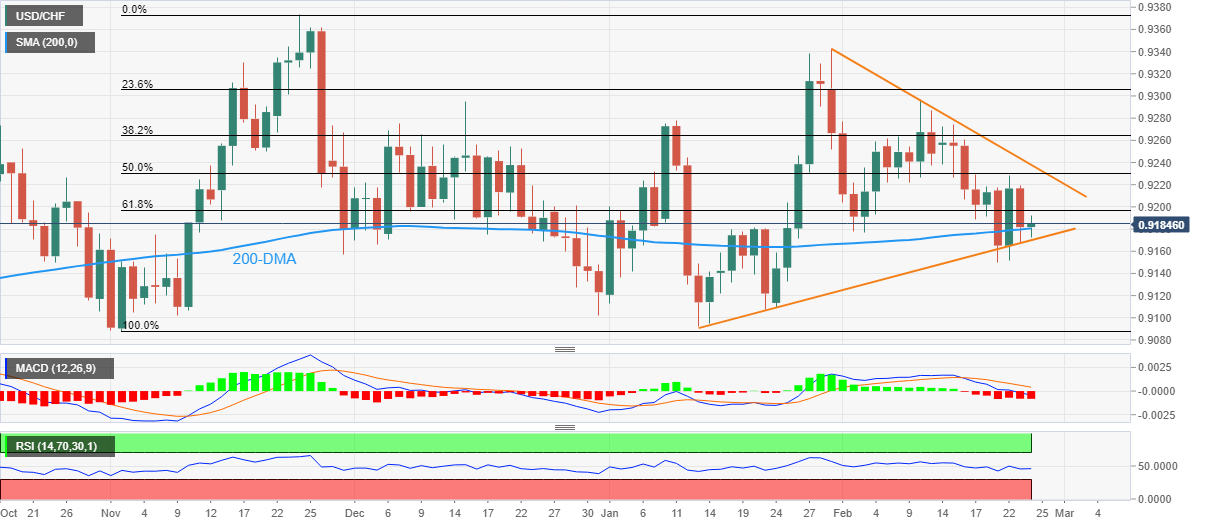
Technically, the USD/CHF pair’s sustained trading below the 61.8% Fibonacci retracement (Fibo.) November 2021 upside joins the bearish MACD signals and downbeat RSI, not oversold, to keep sellers hopeful.

However, an upward sloping trend line from January 13, around 0.9168 at the latest, restricts the quote’s immediate declines.

Following that, 0.9140 and the 0.9100 threshold may test the pair bears before directing them to the late 2021 low near 0.9088.

Alternatively, an upside clearance of the 61.8% Fibo. level of 0.9196 will need validation from the 0.9200 round figure to direct USD/CHF buyers towards the weekly top near 0.9230.

Though, a descending resistance line from January 31 will challenge the pair bulls afterward, around 0.9240 at the latest.

USD/CHF: Daily chart
Trend: Bearish

Additional important levels

Overview
Today last price0.9178
Today Daily Change-0.0004
Today Daily Change %-0.04%
Today daily open0.9182
 
Trends
Daily SMA200.9235
Daily SMA500.9202
Daily SMA1000.9211
Daily SMA2000.918
 
Levels
Previous Daily High0.9219
Previous Daily Low0.9168
Previous Weekly High0.9274
Previous Weekly Low0.9188
Previous Monthly High0.9343
Previous Monthly Low0.9092
Daily Fibonacci 38.2%0.9188
Daily Fibonacci 61.8%0.9199
Daily Pivot Point S10.916
Daily Pivot Point S20.9139
Daily Pivot Point S30.9109
Daily Pivot Point R10.9211
Daily Pivot Point R20.924
Daily Pivot Point R30.9262

Author

Anil Panchal

Anil Panchal

FXStreet

Anil Panchal has nearly 15 years of experience in tracking financial markets. With a keen interest in macroeconomics, Anil aptly tracks global news/updates and stays well-informed about the global financial moves and their implications.


More from Anil Panchal
Share:

Editor's Picks

AUD/USD defies gravity; focus is back to 0.7000

AUD/USD has maintained its bid bias around 0.6970 ahead of the opening bell in Asia on Tuesday. The pair has added to Friday’s rebound, retargeting the 0.7000 hurdle despite another day of firm gains in the Greenback. Looking ahead, Westpac will publish its Consumer Confidence gauge on the domestic calendar.

USD/JPY retakes 158.00 amid hawkish BoJ bets, firmer USD

USD/JPY erases losses and retakes 158.00 in the Asian session on Monday, trading within a one-week-old range. Geopolitical uncertainty continues to underpin the US Dollar, despite fading Fed rate hike hopes, supporting the pair's rebound. However, further upside could be capped by hawkish BoJ expectations and looming intervention risks that could support the Japanese Yen.

Gold treads water around $4,150

Gold now regains some composure and approaches the $4,150 mark per troy ounce late on Monday. The precious metal’s vacillating price action comes in response to the persistent advance in the US Dollar in combination with the resurgence of the upside momentum in US Treasury yields across the curve.

Bitcoin and Gold Outlook: BTC slips, XAU downtrend persists as US Services PMI misses forecasts
Bitcoin (BTC) faces growing headwinds on Monday, as it trades lower below $86,000. Despite the ongoing pullback, the Crypto King remains in a broad range with the lower limit near $84,000 and the upper limit at $88,000. A break on either side of this zone would influence BTC's direction. Gold (XAU/USD), meanwhile, retains a dominant bearish outlook as price action continues downward toward $4,100.
Eurozone inflation just hit 3.8%, its highest in three years. This chart shows why the ECB can’t simply hike its way out

The ECB would normally have a relatively straightforward answer to inflation running almost twice its target: raise interest rates. But these are not normal circumstances. This time, the bond market is already doing part of the tightening for it, leaving the ECB facing an increasingly difficult dilemma.

Eurozone inflation just hit 3.8%, its highest in three years. This chart shows why the ECB can’t simply hike its way out

The ECB would normally have a relatively straightforward answer to inflation running almost twice its target: raise interest rates. But these are not normal circumstances. This time, the bond market is already doing part of the tightening for it, leaving the ECB facing an increasingly difficult dilemma.














