|

USD/CHF Price Analysis: Pullback remains elusive beyond 0.9280

  • USD/CHF remains pressured near intraday low, prints the first daily loss in three.
  • Multiple supports stand tall to challenge sellers even as looming bear cross on MACD signal further downside.
  • 200-HMA, two-week-old descending trend line guard immediate upside.

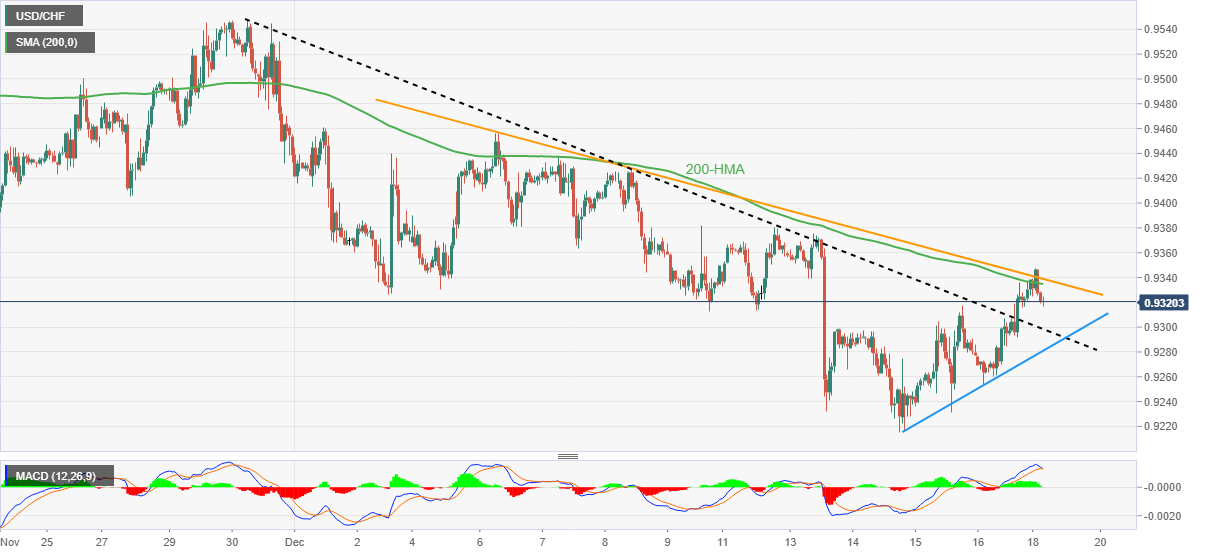
USD/CHF holds lower ground near the intraday bottom as bears struggle to retake control, after a two-day leave, during early Monday. That said, the Swiss Franc (CHF) pair prints mild losses near 0.9320 by the press time.

The quote’s latest weakness could be linked to the U-turn from a fortnight-long descending resistance line, as well as the 200-HMA. Also keeping the USD/CHF bears hopeful is the looming bear cross on the MACD indicator.

However, the downside moves remain unconvincing to the pair bears unless the quote stays beyond the previous resistance line from November 30, close to the 0.9300 threshold by the press time.

Also challenging the USD/CHF bulls is an upward-sloping trend line from the last Wednesday, around 0.9280 at the latest.

In a case where the quote remains bearish below 0.9280, the odds of witnessing a downturn toward the monthly low near 0.9215 can’t be ruled out.

On the flip side, buyers need to keep the reins past 0.9350 to mark their dominance. In doing so, the quote should stay past the aforementioned immediate resistance line and the 200-HMA.

Following that, a run-up towards the 0.9400 threshold and then to the monthly high 0.9470 can’t be ruled out.

USD/CHF: Hourly chart
Trend: Further weakness expected

Additional important levels

Overview
Today last price0.9323
Today Daily Change-0.0015
Today Daily Change %-0.16%
Today daily open0.9338
 
Trends
Daily SMA200.9407
Daily SMA500.9679
Daily SMA1000.9678
Daily SMA2000.9647
 
Levels
Previous Daily High0.9338
Previous Daily Low0.9254
Previous Weekly High0.938
Previous Weekly Low0.9216
Previous Monthly High1.0148
Previous Monthly Low0.9357
Daily Fibonacci 38.2%0.9306
Daily Fibonacci 61.8%0.9286
Daily Pivot Point S10.9282
Daily Pivot Point S20.9225
Daily Pivot Point S30.9197
Daily Pivot Point R10.9367
Daily Pivot Point R20.9395
Daily Pivot Point R30.9451

Author

Anil Panchal

Anil Panchal

FXStreet

Anil Panchal has nearly 15 years of experience in tracking financial markets. With a keen interest in macroeconomics, Anil aptly tracks global news/updates and stays well-informed about the global financial moves and their implications.


More from Anil Panchal
Share:

Editor's Picks

GBP/USD stays firm near 1.3350 amid easing Mideast tensions

GBP/USD builds on Friday's modest bounce from a three-week low and gains strong follow-through positive traction at the start of a new week on Monday. This marks the second straight day of gains, with the major trading near 1.3350 in European trading amid a pause in the Middle East conflict and a broadly weaker US Dollar. Traders brace for the Fed and BoE policy announcements later in the week.

EUR/USD holds gains near 1.1400 as USD slips on Iran diplomacy hopes

EUR/USD holds sizeable gains near the 1.1400 mark in the European session on Monday. The intraday strength is sponsored by a broadly weaker US Dollar, weighed down by renewed optimism over a diplomatic resolution to end a five-month-old US-Iran war.

Gold stands firm on US-Iran diplomacy hopes, reduced Fed hike bets; bulls lack conviction
Gold (XAU/USD) continues with its struggle to capitalize on a modest gap-up opening beyond the $4,100 mark through the early European session on Monday as bulls seem hesitant ahead of the crucial FOMC meeting this week. Heading into the key central bank event, reviving hopes for a diplomatic resolution to end a five-month-old US-Iran war led to a steep fall in crude oil prices.
Bitcoin holds above key support amid ETF inflows, US-Iran bombing pause
Bitcoin (BTC) holds above the key 200-week Simple Moving Average (SMA) around $63,500, having posted four consecutive weeks of gains. Institutional demand shows mild signs of improvement with spot Exchange Traded Funds (ETFs) posting inflows for a third consecutive week.
Bitcoin Price Prediction: BTC holds above key support amid ETF inflows, US-Iran bombing pause
Bitcoin (BTC) holds above the key 200-week Simple Moving Average (SMA) around $63,500, having posted four consecutive weeks of gains. Institutional demand shows mild signs of improvement with spot Exchange Traded Funds (ETFs) posting inflows for a third consecutive week.
US Dollar mid-year outlook: Exceptional currency, exceptional risks?
The US Dollar enters the second half of 2026 in a markedly different position from a year ago. The King currency has recovered, reflecting persistent US inflation, changing expectations for Fed policy, geopolitical tensions and renewed demand for defensive assets.














