USD/CHF Price Analysis: Bounces off 14-month low but stays on the bear’s radar below 0.9200


  • USD/CHF consolidates recent losses around the lowest levels since November 2021.
  • A two-month-old bearish channel, downbeat oscillators keep sellers hopeful.
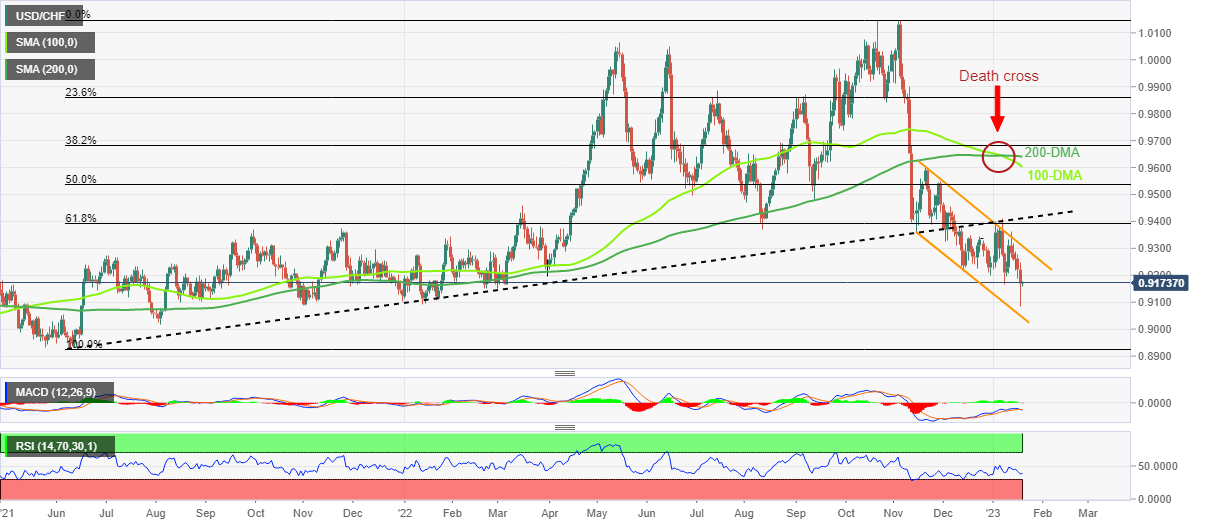
  • Bear cross, clear downside break of key ascending trend line adds strength to the bearish bias.
  • Recovery remains elusive unless the quote stays below 200-DMA.

USD/CHF picks up bids to lick its wounds around the lowest levels since November 2021, marked the previous day, during Thursday’s quiet Asian session.

Even so, the Swiss currency (CHF) pair remains on the bear’s radar as it stays inside a bearish channel connecting multiple levels marked since November 2022.

Also, the impending bear cross on the MACD and descending RSI line, not oversold, suggest the quote’s further downside.

Above all, the USD/CHF pair’s sustained trading below the key support line from mid-2021, as well as the 100-DMA’s piercing off the 200-DMA from above, known as the “death cross”, offer extra reasons to expect the quote’s further weakness.

It should be noted that the 61.8% Fibonacci retracement level of the pair’s June 2021 to November 2022 upside, near 0.9390, acts nearby hurdle for the pair.

That said, a broad bearish range between 0.9040 and 0.9320 restrict short-term USD/CHF moves ahead of the multi-month-old previous support line, around 0.9420.

In a case where USD/CHF manages to cross the 0.9420 hurdle, the 100-DMA and the 200-DMA, respectively near 0.9600 and 0.9640 could act as the last defenses of the USD/CHF bears.

On the contrary, a downside break of 0.9040 could witness the 0.9000 psychological manget as an extra filter to the south before challenging the mid-2021 bottom surrounding 0.8925.

USD/CHF: Daily chart

Trend: Further downside expected

Additional important levels

Overview
Today last price 0.9172
Today Daily Change 0.0004
Today Daily Change % 0.04%
Today daily open 0.9168
 
Trends
Daily SMA20 0.9277
Daily SMA50 0.9359
Daily SMA100 0.9609
Daily SMA200 0.9642
 
Levels
Previous Daily High 0.9246
Previous Daily Low 0.9085
Previous Weekly High 0.9363
Previous Weekly Low 0.9167
Previous Monthly High 0.9471
Previous Monthly Low 0.9201
Daily Fibonacci 38.2% 0.9147
Daily Fibonacci 61.8% 0.9185
Daily Pivot Point S1 0.9087
Daily Pivot Point S2 0.9006
Daily Pivot Point S3 0.8926
Daily Pivot Point R1 0.9248
Daily Pivot Point R2 0.9327
Daily Pivot Point R3 0.9408


Share: Feed news

Information on these pages contains forward-looking statements that involve risks and uncertainties. Markets and instruments profiled on this page are for informational purposes only and should not in any way come across as a recommendation to buy or sell in these assets. You should do your own thorough research before making any investment decisions. FXStreet does not in any way guarantee that this information is free from mistakes, errors, or material misstatements. It also does not guarantee that this information is of a timely nature. Investing in Open Markets involves a great deal of risk, including the loss of all or a portion of your investment, as well as emotional distress. All risks, losses and costs associated with investing, including total loss of principal, are your responsibility. The views and opinions expressed in this article are those of the authors and do not necessarily reflect the official policy or position of FXStreet nor its advertisers. The author will not be held responsible for information that is found at the end of links posted on this page.

If not otherwise explicitly mentioned in the body of the article, at the time of writing, the author has no position in any stock mentioned in this article and no business relationship with any company mentioned. The author has not received compensation for writing this article, other than from FXStreet.

FXStreet and the author do not provide personalized recommendations. The author makes no representations as to the accuracy, completeness, or suitability of this information. FXStreet and the author will not be liable for any errors, omissions or any losses, injuries or damages arising from this information and its display or use. Errors and omissions excepted.

The author and FXStreet are not registered investment advisors and nothing in this article is intended to be investment advice.

Recommended content


Recommended content

Editors’ Picks

EUR/USD holds below 1.0750 ahead of key US data

EUR/USD holds below 1.0750 ahead of key US data

EUR/USD trades in a tight range below 1.0750 in the European session on Friday. The US Dollar struggles to gather strength ahead of key PCE Price Index data, the Fed's preferred gauge of inflation, and helps the pair hold its ground. 

EUR/USD News

USD/JPY stays firm above 156.00 after BoJ Governor Ueda's comments

USD/JPY stays firm above 156.00 after BoJ Governor Ueda's comments

USD/JPY stays firm above 156.00 after surging above this level on the Bank of Japan's decision to leave the policy settings unchanged. BoJ Governor said weak Yen was not impacting prices but added that they will watch FX developments closely.

USD/JPY News

Gold price oscillates in a range as the focus remains glued to the US PCE Price Index

Gold price oscillates in a range as the focus remains glued to the US PCE Price Index

Gold price struggles to attract any meaningful buyers amid the emergence of fresh USD buying. Bets that the Fed will keep rates higher for longer amid sticky inflation help revive the USD demand.

Gold News

Bitcoin Weekly Forecast: BTC’s next breakout could propel it to $80,000 Premium

Bitcoin Weekly Forecast: BTC’s next breakout could propel it to $80,000

Bitcoin’s recent price consolidation could be nearing its end as technical indicators and on-chain metrics suggest a potential upward breakout. However, this move would not be straightforward and could punish impatient investors. 

Read more

US core PCE inflation set to signal firm price pressures as markets delay Federal Reserve rate cut bets

US core PCE inflation set to signal firm price pressures as markets delay Federal Reserve rate cut bets

The core PCE Price Index, which excludes volatile food and energy prices, is seen as the more influential measure of inflation in terms of Fed positioning. The index is forecast to rise 0.3% on a monthly basis in March, matching February’s increase. 

Read more

Forex MAJORS

Cryptocurrencies

Signatures