USD/CAD Price Analysis: Trades in tight range above 1.3600 ahead of US Inflation
- USD/CAD stays sideways near 1.3600 with US inflation in focus.
- The core CPI is estimated to have grown steadily by 3.4% on monthly as well as annual basis.
- Easing Canadian labor market conditions boost BoC’s rate-cut prospects.

The USD/CAD pair consolidates in a tight range above the round-level support of 1.3600 in Thursday’s European session. The Loonie asset turns sideways as investors await the United States (US) consumer inflation data for June, which will be published at 12:30 GMT.
The US Consumer Price Index (CPI) report is expected to show that annual and monthly core inflation, which excludes volatile food and energy prices, grew steadily by 3.4% and 0.2%, respectively. Annual headline inflation is estimated to have decelerated to 3.1% from 3.3% in May.
The inflation data will exhibit the strength in the market speculation for the Federal Reserve (Fed) to begin reducing interest rates from the September meeting. Ahead of the US inflation data, the US Dollar Index (DXY), which tracks the Greenback’s value against six major currencies, remains on the backfoot around 105.00.
Meanwhile, the Canadian Dollar is under pressure amid growing speculation that the Bank of Canada (BoE) will deliver subsequent rate cuts. Deteriorating Canadian labor market conditions have boosted expectations of more rate cuts by the BoE.
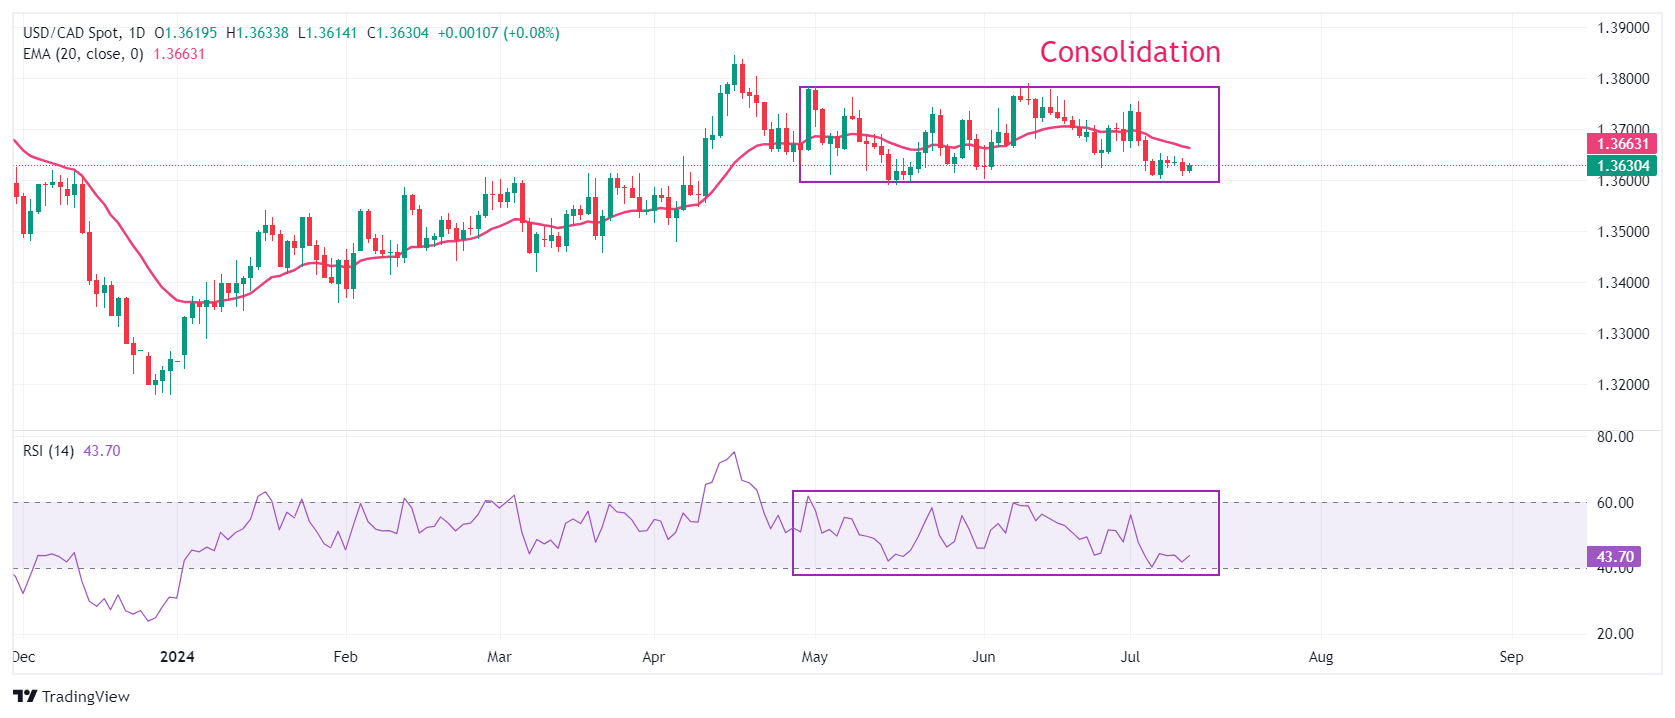
USD/CAD exhibits a sheer volatility contraction, trading in a limited range of 1.3600-1.3780 for more than two months. A volatility contraction suggests lower volume and small ticks, while a breakout in the same results in wider ticks and heavy volume.
The asset trades below the 20-day Exponential Moving Average (EMA) near 1.3663, suggesting that the near-term outlook is bearish.
The 14-period Relative Strength Index (RSI) oscillates inside the 40.00-60.00 range, indicating indecisiveness among market participants.
A decisive breakdown below May 3 low around 1.3600 will expose the asset to April 9 low around 1.3547 and the psychological support of 1.3500.
On the flip side, a fresh buying opportunity would emerge if the asset breaks above June 11 high near 1.3800. This would drive the asset towards April 17 high at 1.3838, followed by 1 November 2023 high at 1.3900.
USD/CAD daily chart
Economic Indicator
Consumer Price Index (YoY)
Inflationary or deflationary tendencies are measured by periodically summing the prices of a basket of representative goods and services and presenting the data as The Consumer Price Index (CPI). CPI data is compiled on a monthly basis and released by the US Department of Labor Statistics. The YoY reading compares the prices of goods in the reference month to the same month a year earlier.The CPI is a key indicator to measure inflation and changes in purchasing trends. Generally speaking, a high reading is seen as bullish for the US Dollar (USD), while a low reading is seen as bearish.
Read more.Next release: Thu Jul 11, 2024 12:30
Frequency: Monthly
Consensus: 3.1%
Previous: 3.3%
Source: US Bureau of Labor Statistics
The US Federal Reserve has a dual mandate of maintaining price stability and maximum employment. According to such mandate, inflation should be at around 2% YoY and has become the weakest pillar of the central bank’s directive ever since the world suffered a pandemic, which extends to these days. Price pressures keep rising amid supply-chain issues and bottlenecks, with the Consumer Price Index (CPI) hanging at multi-decade highs. The Fed has already taken measures to tame inflation and is expected to maintain an aggressive stance in the foreseeable future.
Author

Sagar Dua
FXStreet
Sagar Dua is associated with the financial markets from his college days. Along with pursuing post-graduation in Commerce in 2014, he started his markets training with chart analysis.


