USD/CAD Price Analysis: Seems vulnerable near 1.3600 ahead of US/Canada Employment
- USD/CAD sees more downside below 1.3600 as the US Dollar remains on the backfoot.
- Easing US labor market strength and rising concerns over economic outlook have weighed on the US Dollar.
- Next major trigger for the Canadian Dollar and the US Dollar will be the Employment data from their respective regions.

The USD/CAD pair appears to be fragile near monthly low around 1.3620 in Thursday’s European session. The Loonie asset weakens as the US Dollar (USD) faces significant selling pressure after the United States (US) ADP Employment Change data for June showed that the strength in the labor market eases and the ISM Services PMI, in the same period, indicated that the economy outlook has become uncertain.
The US Dollar Index (DXY), which tracks the Greenback’s value against six major currencies, declines to near 105.30.
The ADP Employment report showed that labor demand in the private sector unexpectedly decline. Number of individuals hired in private sector were 150K, lower than expectations of 160K and the prior release of 157K. The ISM Services PMI, a measure to activities in service sector that accounts for two-third of the economy, recorded at lowest in four years.
Going forward, the US Dollar and the Canadian Dollar (CAD) will dance to the tunes of the official Employment data for June, which will be published on Friday.
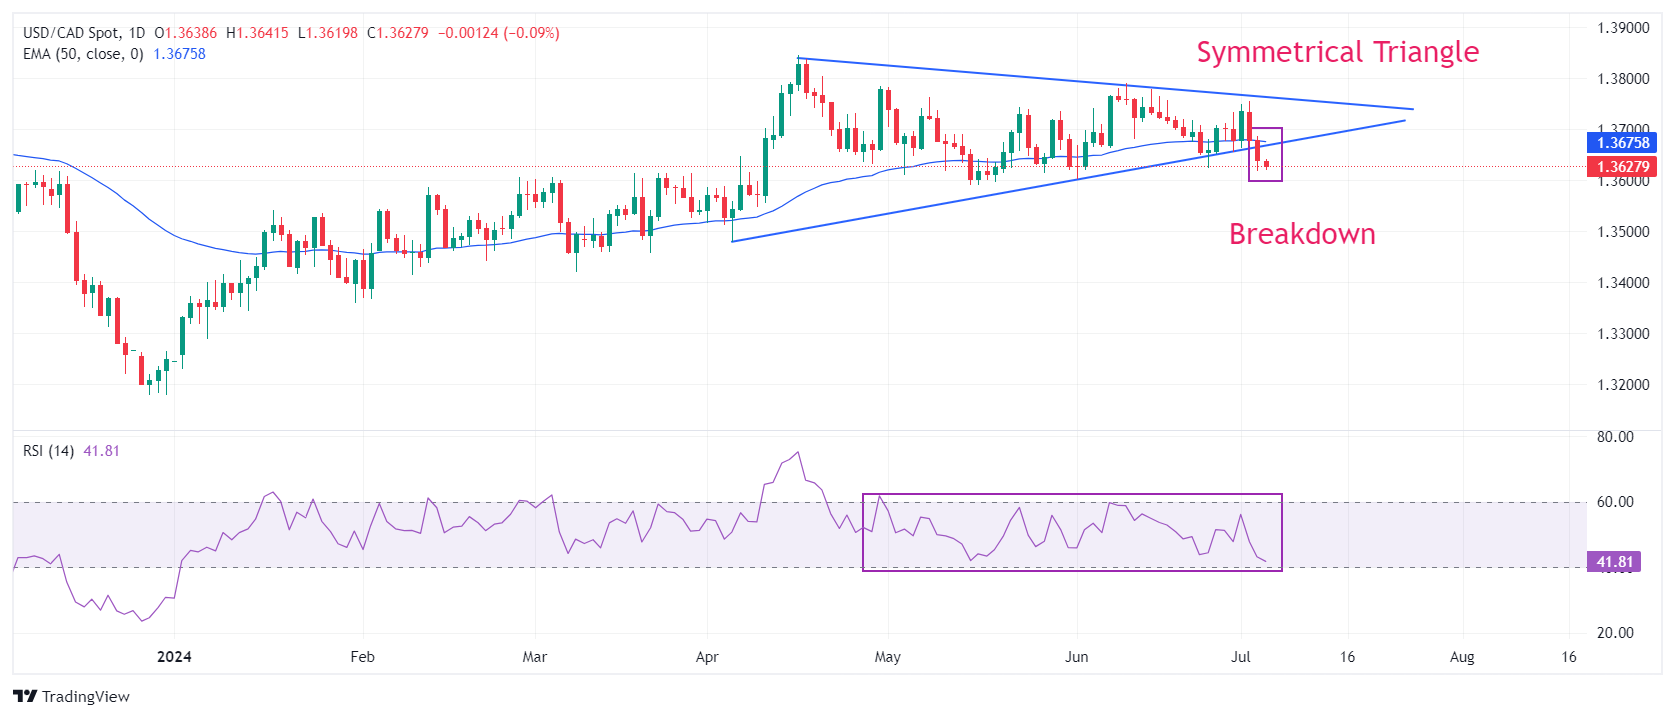
USD/CAD extends its losing streak for the third trading session on Thursday. The Loonie asset falls into the bearish trajectory after a breakdown of the Symmetrical Triangle formation on a daily timeframe. The above-mentioned chart pattern indicates a sharp volatility contraction and a downside break in the same results in wider bearish ticks and heavy selling volume.
The major shifts below the 50-day Exponential Moving Average near 1.3676, suggesting that the near-term trend is bearish.
The 14-day Relative Strength Index (RSI) has declined to near 40.00. A decisive break below 60.00 levels would push momentum on the downside.
A decisive breakdown below May 3 low around 1.3600 will expose the asset to April 9 low around 1.3547 and the psychological support of 1.3500.
On the flip side, a fresh buying opportunity would emerge if the asset breaks above June 11 high near 1.3800. This would drive the asset towards April 17 high at 1.3838, followed by 1 November 2023 high at 1.3900.
USD/CAD daily chart
Economic Indicator
Net Change in Employment
The Net Change in Employment released by Statistics Canada is a measure of the change in the number of people in employment in Canada. Generally speaking, a rise in this indicator has positive implications for consumer spending and indicates economic growth. Therefore, a high reading is seen as bullish for the Canadian Dollar (CAD), while a low reading is seen as bearish.
Read more.Next release: Fri Jul 05, 2024 12:30
Frequency: Monthly
Consensus: 22.5K
Previous: 26.7K
Source: Statistics Canada
Canada’s labor market statistics tend to have a significant impact on the Canadian dollar, with the Employment Change figure carrying most of the weight. There is a significant correlation between the amount of people working and consumption, which impacts inflation and the Bank of Canada’s rate decisions, in turn moving the C$. Actual figures beating consensus tend to be CAD bullish, with currency markets usually reacting steadily and consistently in response to the publication.
Author

Sagar Dua
FXStreet
Sagar Dua is associated with the financial markets from his college days. Along with pursuing post-graduation in Commerce in 2014, he started his markets training with chart analysis.


