|

USD/CAD Price Analysis: Rises to near 1.3750 nearing lower boundary of rising channel

  • USD/CAD could test the lower boundary of the rising channel, potentially rebounding to re-enter the rising channel.
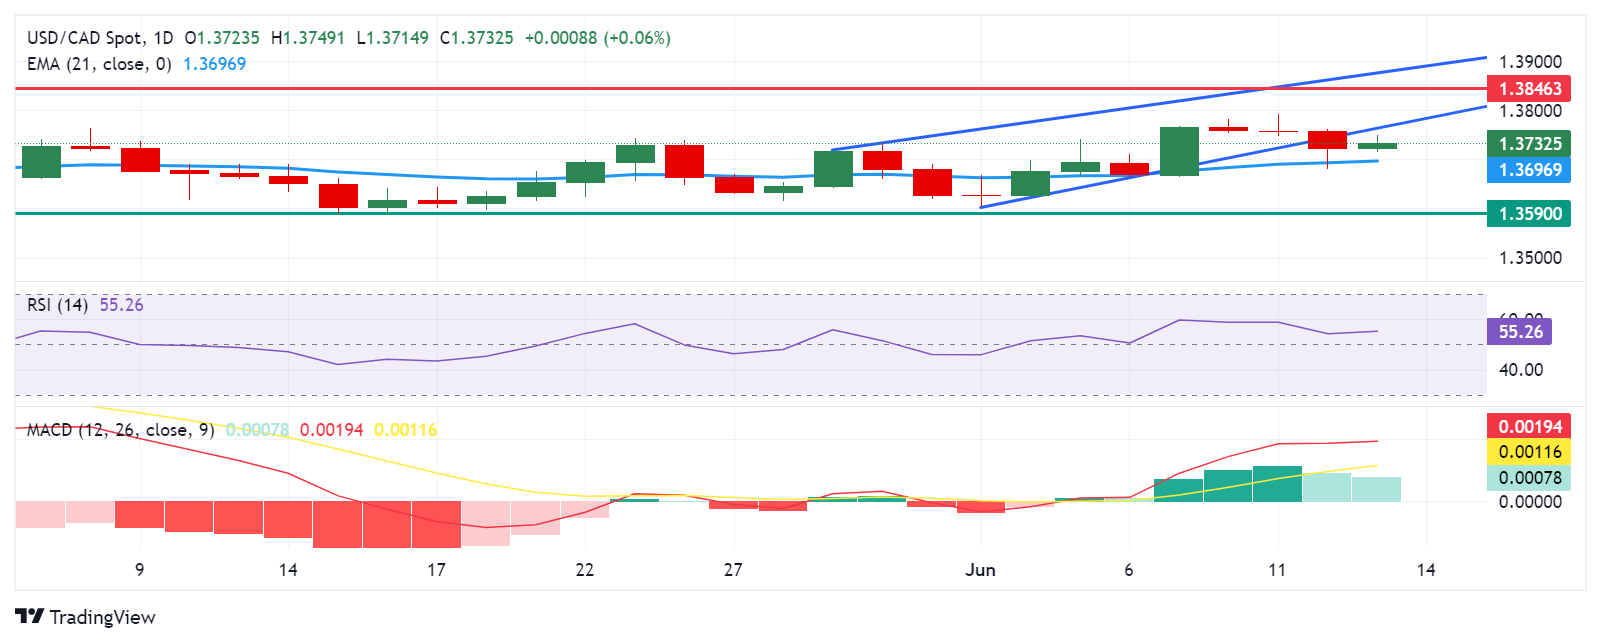
  • A break below the 50 level on the 14-day RSI could indicate the emergence of a bearish bias.
  • The pair may find immediate support at the psychological level of 1.3700 and the 21-day EMA of 1.3697 level.

USD/CAD breaks its three-day losing streak, trading around 1.3730 during the European session on Thursday. Analysis of the daily chart suggests a weakening bullish bias for the USD/CAD pair, as it has broken below the rising channel pattern. However, the 14-day Relative Strength Index (RSI) is still positioned slightly above the 50 level. Further movement may give a clear directional indication.

Additionally, the momentum indicator Moving Average Convergence Divergence (MACD) suggests a bullish trend for the pair as the MACD line is positioned above the centerline, it shows divergence above the signal line.

The USD/CAD pair may test the lower boundary of the rising channel around the level of 1.3760, followed by the key barrier at the psychological level of 1.3800. A return to the rising channel could reinforce the bullish bias and support the pair to explore the region April’s high of 1.3846.

A break above the latter could lead the USD/CAD pair to approach the upper threshold of the rising channel around the level of 1.3870.

On the downside, the USD/CAD pair could find immediate support at the psychological level of 1.3700, aligned with the 21-day Exponential Moving Average (EMA) of 1.3697 level. A break below this level could exert pressure on the pair to navigate the region of the throwback support at 1.3590.

USD/CAD: Daily Chart

USD/CAD

Overview
Today last price1.3732
Today Daily Change0.0008
Today Daily Change %0.06
Today daily open1.3724
 
Trends
Daily SMA201.3679
Daily SMA501.3685
Daily SMA1001.3598
Daily SMA2001.358
 
Levels
Previous Daily High1.3761
Previous Daily Low1.368
Previous Weekly High1.3768
Previous Weekly Low1.3603
Previous Monthly High1.3783
Previous Monthly Low1.359
Daily Fibonacci 38.2%1.3711
Daily Fibonacci 61.8%1.373
Daily Pivot Point S11.3682
Daily Pivot Point S21.3641
Daily Pivot Point S31.3601
Daily Pivot Point R11.3763
Daily Pivot Point R21.3802
Daily Pivot Point R31.3844

Author

Akhtar Faruqui

Akhtar Faruqui is a Forex Analyst based in New Delhi, India. With a keen eye for market trends and a passion for dissecting complex financial dynamics, he is dedicated to delivering accurate and insightful Forex news and analysis.

More from Akhtar Faruqui
Share:

Markets move fast. We move first.

Orange Juice Newsletter brings you expert driven insights - not headlines. Every day on your inbox.

By subscribing you agree to our Terms and conditions.

Editor's Picks

EUR/USD rebounds after falling toward 1.1700

EUR/USD gains traction and trades above 1.1730 in the American session, looking to end the week virtually unchanged. The bullish opening in Wall Street makes it difficult for the US Dollar to preserve its recovery momentum and helps the pair rebound heading into the weekend.

GBP/USD steadies below 1.3400 as traders assess BoE policy outlook

Following Thursday's volatile session, GBP/USD moves sideways below 1.3400 on Friday. Investors reassess the Bank of England's policy oıtlook after the MPC decided to cut the interest rate by 25 bps by a slim margin. Meanwhile, the improving risk mood helps the pair hold its ground.

Gold stays below $4,350, looks to post small weekly gains

Gold struggles to gather recovery momentum and stays below $4,350 in the second half of the day on Friday, as the benchmark 10-year US Treasury bond yield edges higher. Nevertheless, the precious metal remains on track to end the week with modest gains as markets gear up for the holiday season.

Crypto Today: Bitcoin, Ethereum, XRP rebound amid bearish market conditions

Bitcoin (BTC) is edging higher, trading above $88,000 at the time of writing on Monday. Altcoins, including Ethereum (ETH) and Ripple (XRP), are following in BTC’s footsteps, experiencing relief rebounds following a volatile week.

How much can one month of soft inflation change the Fed’s mind?

One month of softer inflation data is rarely enough to shift Federal Reserve policy on its own, but in a market highly sensitive to every data point, even a single reading can reshape expectations. November’s inflation report offered a welcome sign of cooling price pressures. 

XRP rebounds amid ETF inflows and declining retail demand demand

XRP rebounds as bulls target a short-term breakout above $2.00 on Friday. XRP ETFs record the highest inflow since December 8, signaling growing institutional appetite.