USD/CAD Price Analysis: Reverses from two-month-old hurdle towards 1.3600


  • USD/CAD renews intraday low, prints the first daily loss in three around monthly top.
  • Key resistance line prods Loonie pair bulls but oscillators, previous run-up suggest the quote’s further advances.
  • Convergence of 50-DMA, three-week-long rising trend line challenges bears.

USD/CAD retreats from the previous monthly high, refreshing intraday low near 1.3625 at the latest, as Loonie buyers return after a two-day recess.

In doing so, the quote portrays a U-turn from a downward-sloping resistance line from March 28, close to 1.3650 by the press time.

The pullback moves, however, appear less impressive as the quote keeps the mid-week breakout of the previous key resistance line stretched from early March amid bullish MACD signals and an upbeat RSI (14) line, not overbought.

Hence, the USD/CAD pair’s pullback remains elusive beyond the resistance-turned-support line of around 1.3560.

Even if the quote breaks the 1.3560 support, a convergence of the 50-DMA and a three-week-long rising trend line, close to 1.3525 at the latest, could challenge the USD/CAD pair sellers before giving them control.

In that case, the 61.8% Fibonacci retracement of February-March upside, near 1.3490, can prod the pair’s downward trajectory targeting an upward-sloping support line from February, around 1.3380.

Alternatively, a daily closing beyond the immediate resistance line surrounding 1.3650 needs validation from the previous monthly high of nearly 1.3670 to recall the Loonie pair buyers.

Following that, the yearly high marked in March around 1.3860 will gain the market’s attention.

USD/CAD: Daily chart
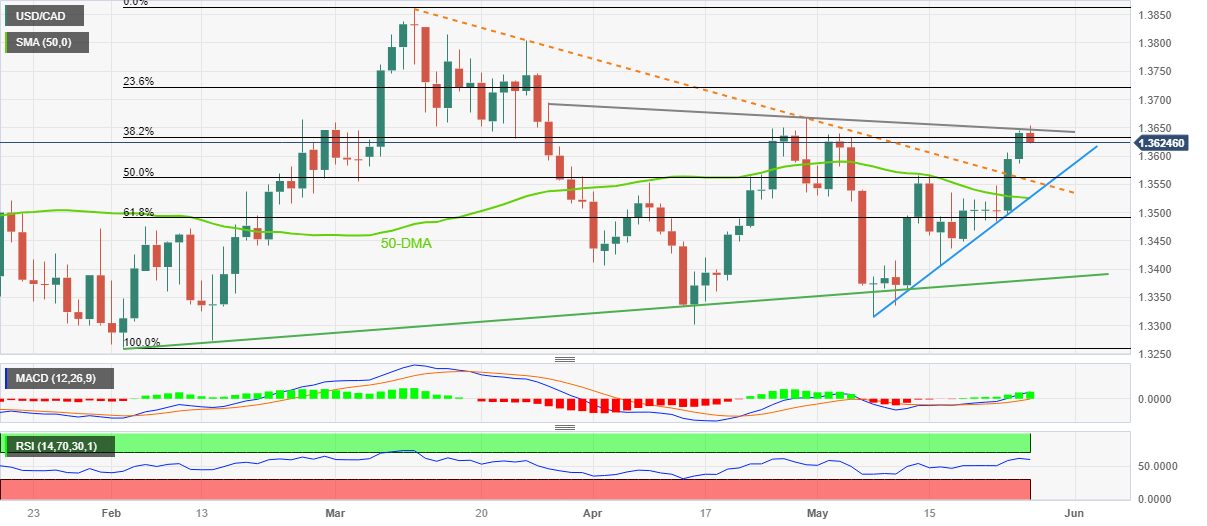
Trend: Bullish

Additional important levels

Overview
Today last price 1.3622
Today Daily Change -0.0019
Today Daily Change % -0.14%
Today daily open 1.3641
 
Trends
Daily SMA20 1.3504
Daily SMA50 1.3527
Daily SMA100 1.351
Daily SMA200 1.349
 
Levels
Previous Daily High 1.3645
Previous Daily Low 1.3586
Previous Weekly High 1.3568
Previous Weekly Low 1.3404
Previous Monthly High 1.3668
Previous Monthly Low 1.3301
Daily Fibonacci 38.2% 1.3623
Daily Fibonacci 61.8% 1.3609
Daily Pivot Point S1 1.3603
Daily Pivot Point S2 1.3566
Daily Pivot Point S3 1.3545
Daily Pivot Point R1 1.3662
Daily Pivot Point R2 1.3682
Daily Pivot Point R3 1.372


Share: Feed news

Information on these pages contains forward-looking statements that involve risks and uncertainties. Markets and instruments profiled on this page are for informational purposes only and should not in any way come across as a recommendation to buy or sell in these assets. You should do your own thorough research before making any investment decisions. FXStreet does not in any way guarantee that this information is free from mistakes, errors, or material misstatements. It also does not guarantee that this information is of a timely nature. Investing in Open Markets involves a great deal of risk, including the loss of all or a portion of your investment, as well as emotional distress. All risks, losses and costs associated with investing, including total loss of principal, are your responsibility. The views and opinions expressed in this article are those of the authors and do not necessarily reflect the official policy or position of FXStreet nor its advertisers. The author will not be held responsible for information that is found at the end of links posted on this page.

If not otherwise explicitly mentioned in the body of the article, at the time of writing, the author has no position in any stock mentioned in this article and no business relationship with any company mentioned. The author has not received compensation for writing this article, other than from FXStreet.

FXStreet and the author do not provide personalized recommendations. The author makes no representations as to the accuracy, completeness, or suitability of this information. FXStreet and the author will not be liable for any errors, omissions or any losses, injuries or damages arising from this information and its display or use. Errors and omissions excepted.

The author and FXStreet are not registered investment advisors and nothing in this article is intended to be investment advice.

Recommended content


Recommended content

Editors’ Picks

EUR/USD flirts with 1.0700 post-US PMIs

EUR/USD flirts with 1.0700 post-US PMIs

EUR/USD maintains its daily gains and climbs to fresh highs near the 1.0700 mark against the backdrop of the resumption of the selling pressure in the Greenback, in the wake of weaker-than-expected flash US PMIs for the month of April.

EUR/USD News

GBP/USD surpasses 1.2400 on further Dollar selling

GBP/USD surpasses 1.2400 on further Dollar selling

Persistent bearish tone in the US Dollar lends support to the broad risk complex and bolsters the recovery in GBP/USD, which manages well to rise to fresh highs north of 1.2400 the figure post-US PMIs.

GBP/USD News

Gold trims losses on disappointing US PMIs

Gold trims losses on disappointing US PMIs

Gold (XAU/USD) reclaims part of the ground lost and pares initial losses on the back of further weakness in the Greenback following disheartening US PMIs prints.

Gold News

Here’s why Ondo price hit new ATH amid bearish market outlook Premium

Here’s why Ondo price hit new ATH amid bearish market outlook

Ondo price shows no signs of slowing down after setting up an all-time high (ATH) at $1.05 on March 31. This development is likely to be followed by a correction and ATH but not necessarily in that order.

Read more

Germany’s economic come back

Germany’s economic come back

Germany is the sick man of Europe no more. Thanks to its service sector, it now appears that it will exit recession, and the economic future could be bright. The PMI data for April surprised on the upside for Germany, led by the service sector.

Read more

Forex MAJORS

Cryptocurrencies

Signatures