|

USD/CAD Price Analysis: Corrects from 1.3800 as US Dollar’s rally stalls ahead of Fed’s decision

  • USD/CAD trades cautiously ahead of US Inflation and Fed’s policy outcome
  • The Fed is expected to leave interest rates unchanged for seventh straight time.
  • The BoC could deliver subsequent rate cuts, given weak labor market conditions.

The USD/CAD pair drops to 1.3740 in Wednesday’s European session after failing to recapture the round-level resistance of 1.3800 on Tuesday. The Loonie asset corrects as firm recovery of almost 1.40$ in the US Dollar Index (DXY) appears to be stalling due to uncertainty ahead of the United States (US) Consumer Price Index (CPI) data for May and the Federal Reserve’s (Fed) interest rate decision, which are scheduled in the North American session.

US annual core CPI, which excludes volatile food and energy prices, is estimated to have eased slightly to 3.5% from April’s release of 3.6%, with headline figures growing steadily by 3.4%. The inflation data turning out to be stubborn would weaken market expectations for the Fed to begin reducing interest rates from the September meeting, while soft number would boost them.

Meanwhile, investors will majorly focus on the Fed’s dot plot as the central bank is expected to remain status quo for the seventh straight time.

The Canadian Dollar remains broadly on the backfoot as investors expect that the Bank of Canada (BoC) could deliver subsequent rate cuts to boost labor demand. Canada’s inflation has already declined into BoC’s preferred core CPI range of 1%-3%.

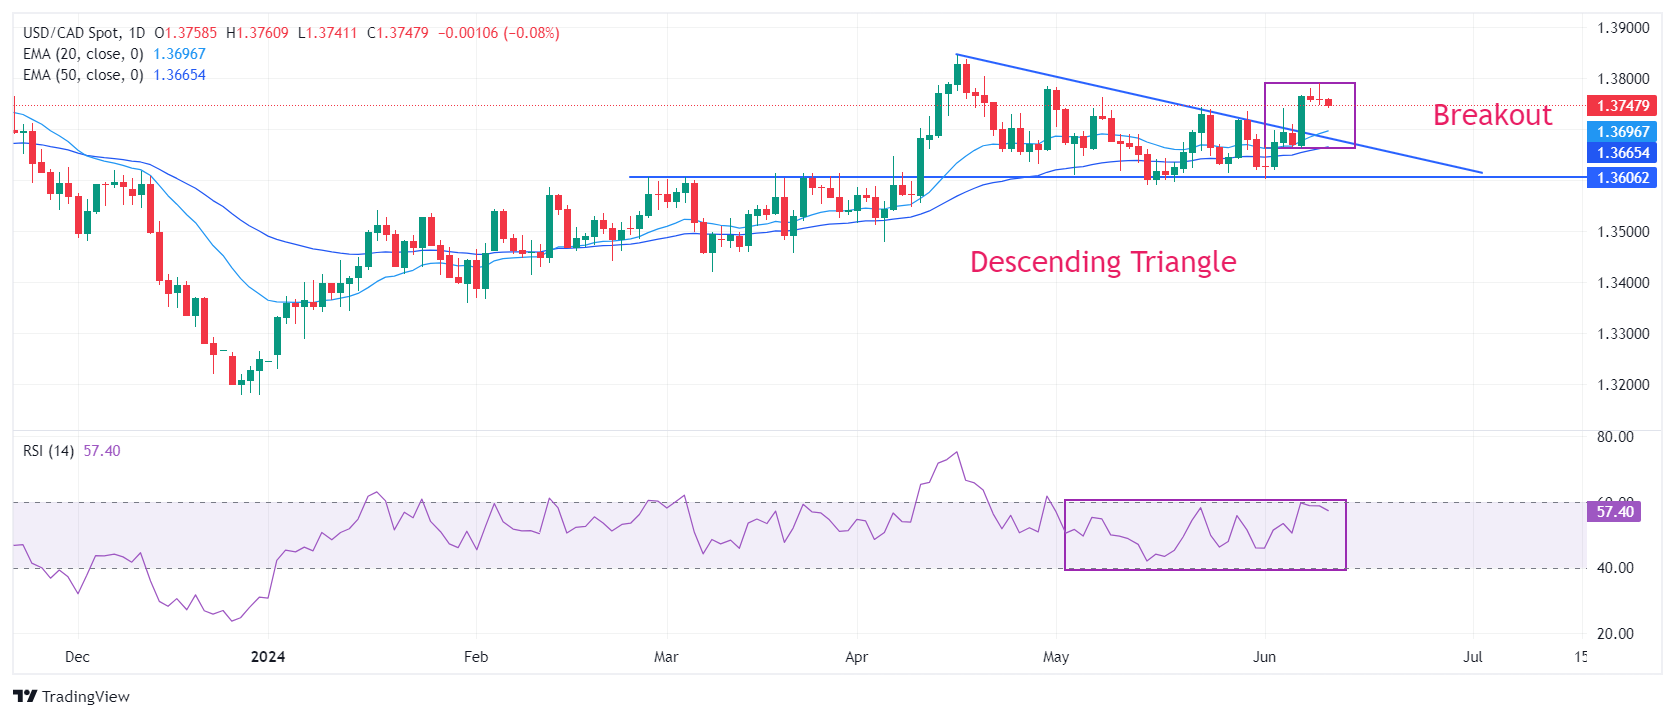
USD/CAD strengthens after a breakout of the Descending Triangle chart pattern formed on a daily timeframe. Upward-sloping 20- and 50-day Exponential Moving Averages (EMAs) near 1.3700 and 1.3660, respectively, suggest that the overall trend is bullish.

The 14-period Relative Strength Index (RSI) hovers near 60.00. A sustainable move above the same will push momentum towards the upside.

Fresh buying opportunity would emerge if the asset breaks above April 17 high at 1.3838. This would drive the asset towards 1 November 2023 high at 1.3900, followed by the psychological resistance of 1.4000.

In an alternate scenario, a breakdown below June 7 low at 1.3663 will expose the asset to May 3 low around 1.3600 and April 9 low around 1.3547.

USD/CAD daily chart

USD/CAD

Overview
Today last price1.3749
Today Daily Change-0.0009
Today Daily Change %-0.07
Today daily open1.3758
 
Trends
Daily SMA201.3673
Daily SMA501.3681
Daily SMA1001.3596
Daily SMA2001.358
 
Levels
Previous Daily High1.3792
Previous Daily Low1.3748
Previous Weekly High1.3768
Previous Weekly Low1.3603
Previous Monthly High1.3783
Previous Monthly Low1.359
Daily Fibonacci 38.2%1.3765
Daily Fibonacci 61.8%1.3775
Daily Pivot Point S11.3741
Daily Pivot Point S21.3723
Daily Pivot Point S31.3697
Daily Pivot Point R11.3784
Daily Pivot Point R21.381
Daily Pivot Point R31.3828

Author

Sagar Dua

Sagar Dua

FXStreet

Sagar Dua is associated with the financial markets from his college days. Along with pursuing post-graduation in Commerce in 2014, he started his markets training with chart analysis.

More from Sagar Dua
Share:

Editor's Picks

AUD/USD eyes 0.7150 barrier nine-day EMA

AUD/USD inches higher after registering modest losses in the previous day, trading around 0.7130 during the Asian hours. The technical analysis of the daily chart indicates that the pair is moving sideways within the rectangle pattern, suggesting a consolidation as neither the bulls nor the bears have enough momentum to take control of the market.

USD/JPY trades below 160.00 intervention threshold; bullish bias intact

The USD/JPY pair attracts some sellers during the Asian session amid fears that authorities will step in again to prop up the Japanese Yen. Furthermore, the Israel-Lebanon truce prompts some profit-taking around the US Dollar and exerts downward pressure on the currency pair.

Gold rebounds from one-week low as Israel-Lebanon truce pressures safe-haven USD

Gold gains some positive traction on Thursday and climbs to the $4,475 area during the Asian session, reversing a major part of the previous day's slide to a one-week low. The Israel-Lebanon truce prompts some profit-taking around the US Dollar and supports the commodity. 


Hyperliquid: ETF demand, capital rotation fuel HYPE rally as Bitcoin melts

Hyperliquid price sustains an upward trend near its all-time high of $75.76 on Thursday after posting 80% gains in May, while Bitcoin (BTC) retraces below $65,000, triggering a market-wide panic.

Kevin Warsh takes the Fed helm: What it means for the US Dollar
The Federal Reserve moves away from the highly predictable "forward guidance" model of the Jerome Powell era to a new “Kevin Warsh environment”, characterized by less communication, more policy surprises, and an increased focus on the Fed's complex balance sheet.
Recession on paper: What really moves the Canadian Loonie now?

Statistics Canada handed the headline writers a gift and the analysts a headache. Real GDP shrank 0.1% on an annualized basis in the first quarter, and with the fourth quarter of 2025 revised down to a 1.0% contraction, that is two negative quarters in a row, the textbook definition of a technical recession and Canada's first since the pandemic.