USD/CAD Price Analysis: Continues to face pressure near 1.3700
- USD/CAD declines from 1.3700 as the US Dollar slumps ahead of the US core PCE inflation reading.
- US Durable Goods Orders barely rose in May.
- The Canadian economy is estimated to have expanded by 0.3% in April.

The USD/CAD pair drops in an attempt to break decisively above the round-level resistance of 1.3700 in Thursday’s New York session. The Loonie asset edges lower as the US Dollar (USD) corrects with focus on the United States (US) core Personal Consumption Expenditure price index (PCE) data for May, which will be published on Friday.
Investors will pay close attention to the underlying inflation as it will provide fresh cues on the interest rate outlook. Soft inflation figures would boost expectations of early rate cuts by the Federal Reserve (Fed) while hot numbers will diminish them.
In the American session, the US Dollar has come under pressure despite the US Durable Goods Orders surprisingly rose for May. Fresh orders for durable goods expanded by 0.1%, while economists projected a decline at a similar pace.
Meanwhile, the next move in the Canadian Dollar will be forecasted by the monthly Gross Domestic Product (GDP) report for April. The report is expected to show that the Canadian economy expanded by 0.3% after a stagnant performance in March.
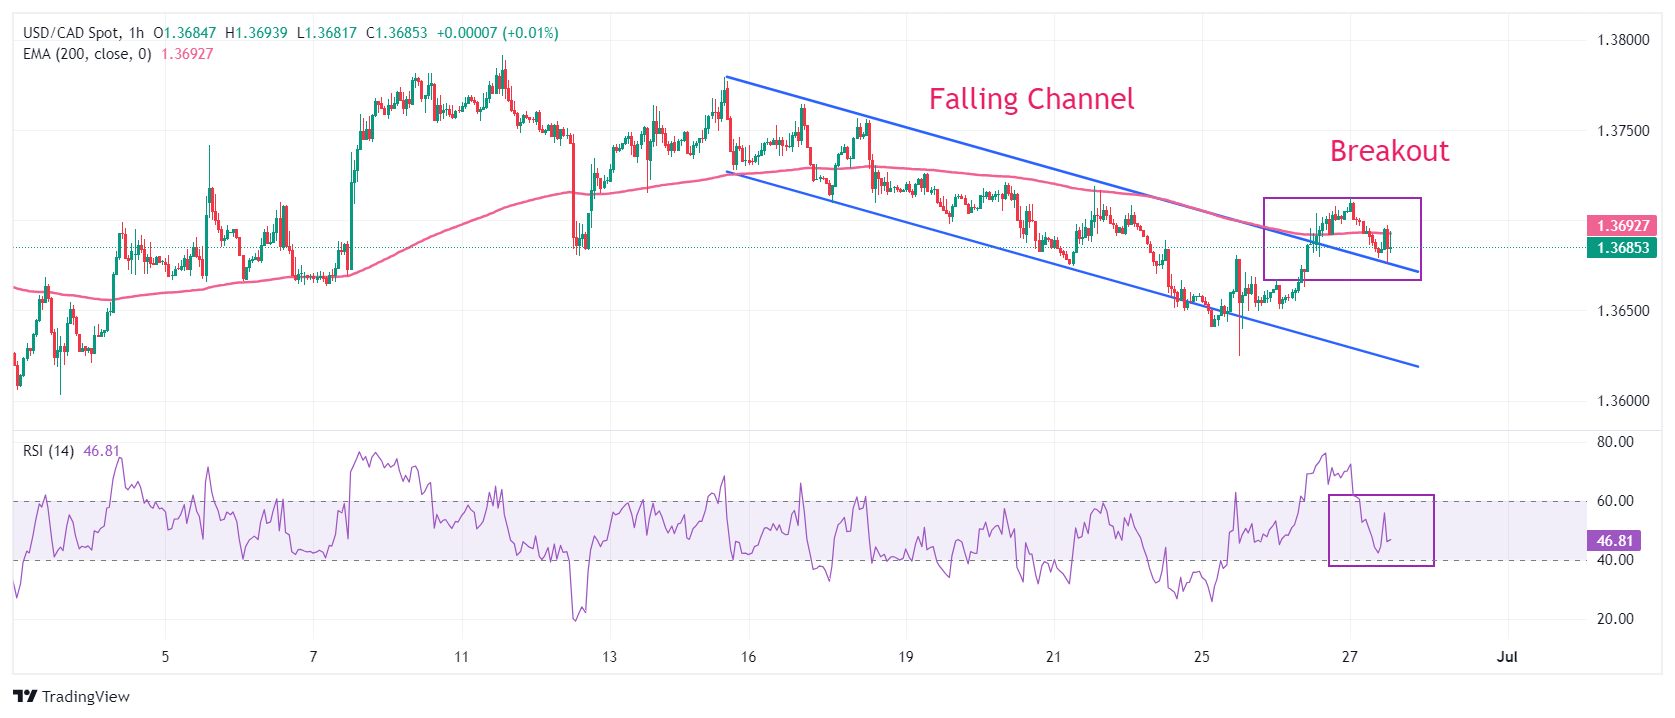
USD/CAD tests the breakout region of the Falling Channel chart pattern formed on an hourly timeframe. A breakout of the above-mentioned chart formation results in a bullish reversal. The asset gathers strength to decisively break above the 200-hour Exponential Moving Average (EMA), which trades around 1.3700.
The 14-period Relative Strength Index (RSI) retreats inside the 40.00-60.00 range, suggesting a consolidation ahead.
Fresh buying opportunity would emerge if the asset breaks above June 11 high near 1.3800. This would drive the asset towards April 17 high at 1.3838, followed by 1 November 2023 high at 1.3900.
In an alternate scenario, a breakdown below June 7 low at 1.3663 will expose the asset to May 3 low around 1.3600 and April 9 low around 1.3547.
USD/CAD hourly chart
Economic Indicator
Gross Domestic Product (MoM)
The Gross Domestic Product (GDP), released by Statistics Canada on a monthly and quarterly basis, is a measure of the total value of all goods and services produced in Canada during a given period. The GDP is considered as the main measure of Canadian economic activity. The MoM reading compares economic activity in the reference month to the previous month. Generally, a high reading is seen as bullish for the Canadian Dollar (CAD), while a low reading is seen as bearish.
Read more.Author

Sagar Dua
FXStreet
Sagar Dua is associated with the financial markets from his college days. Along with pursuing post-graduation in Commerce in 2014, he started his markets training with chart analysis.


