US Dollar flat with Europe set to close off turbulent week on French politics
- The US Dollar flat with dust settling over Nonfarm Payrolls number.
- The Greenback is being rebalanced with markets looking for a December rate cut from the Fed.
- The US Dollar Index (DXY) is back above pivotal support at 105.50, heading to 106.00

The US Dollar (USD) is letting the dust settle of the 227,000 print in the Nonfarm Payrolls numbers. That 227,000 is firmly in line of estimates that ranged from 135,000 on the downside to 252,000 on the upside. The fact that the number did break above the highest estimate just ahead of always intensive holiday and shopping season, is seen as in issue. Already earlier this week alarm bells were going off when the Institute for Supply Management (ISM) saw the employment component come in softer than expected for the Services and Manufacturing sector.
Friday will end with the University of Michigan preliminary Consumer Sentiment Index reading and with four Federal Reserve officials making appearances. The focus will start to shift next week to the Fed rate desicion. That makes comments from Fed officials near to the event of December 18th a very good guide if a rate cut is to be expected.
Daily digest market movers: Fed members are taking over
- The US Jobs Report for November has been released:
- The Nonfarm Payrolls print came in at 227,000 against the previous 12,000 increase. The estimates ranged from 135,000 on the downside to 252,000 on the upside.
- The Unemployment Rate ticked up to 4.2% from 4.1%.
- The Monthly Average Hourly Earnings number came in at 0.4%, above the expected 0.3%, steady from the previous 0.4%.
- The University of Michigan has delivered its preliminary reading for December:
- Consumer Sentiment went to 74, beating the 73 estimate and coming from 71.8 previously.
- The 5-year inflation expectations rate fell to 3.1%, from 3.2% in November.
- A slew of Fed speakers will take the stage:
- Near 14:15 GMT, comments are expected from Federal Reserve Governor Michelle Bowman, who participates in a virtual conversation at the Missouri Bankers Association Executive Management Conference.
- At 15:30 GMT, Federal Reserve Bank of Chicago President Austan Goolsbee participates in a fireside chat at the 38th Economic Outlook Symposium organized by the Chicago Fed.
- Around 17:00 GMT, comments are expected from Federal Reserve Bank of Cleveland President Beth Hammack who delivers remarks about the US economic outlook at an event organized by the City Club of Cleveland.
- Federal Reserve Bank of San Francisco President Mary Daly will be the last Fed speaker this Friday at 18:00 GMT, participating in a moderated conversation and Q&A session at an event hosted by Stanford University's Hoover Institution.
- Equities are happy with the Nonfarm Payrolls print and are opening the door for a rate cut in December by going higher. Both European indices and US equities are ticking up towards the US Opening Bell.
- The CME FedWatch Tool is pricing in another 25 basis points (bps) rate cut by the Fed at the December 18 meeting by 70.1%. A 29.9% chance is for rates to remain unchanged. The Fed Minutes and recent comments from several Fed officials have helped the rate cut odds for December to move higher.
- The US 10-year benchmark rate trades at 4.14%, setting a new low for this week.
US Dollar Index Technical Analysis: Fed will start to take control again
The US Dollar Index (DXY) is back to where it was roughly one month ago after retreating since it tried to topple the 108.00 level. The risk with the Nonfarm Payrolls print is that, if the number is far below estimates, the DXY could fall back all the way to pre-election levels at 104.25.
On the upside, 106.52 (April 16 high) is apparently a hard nut to crack as a first resistance after failing to close above it this week after several attempts. Should the US Dollar bulls reclaim that level, 107.00 (round level) and 107.35 (October 3, 2023, high) are back on target for a retest.
Looking down, the pivotal level at 105.53 (April 11 high) comes into play before heading into the 104-region. Should the DXY fall all the way towards 104.00, the big figure and the 200-day Simple Moving Average at 104.03 should catch any falling knife formation.
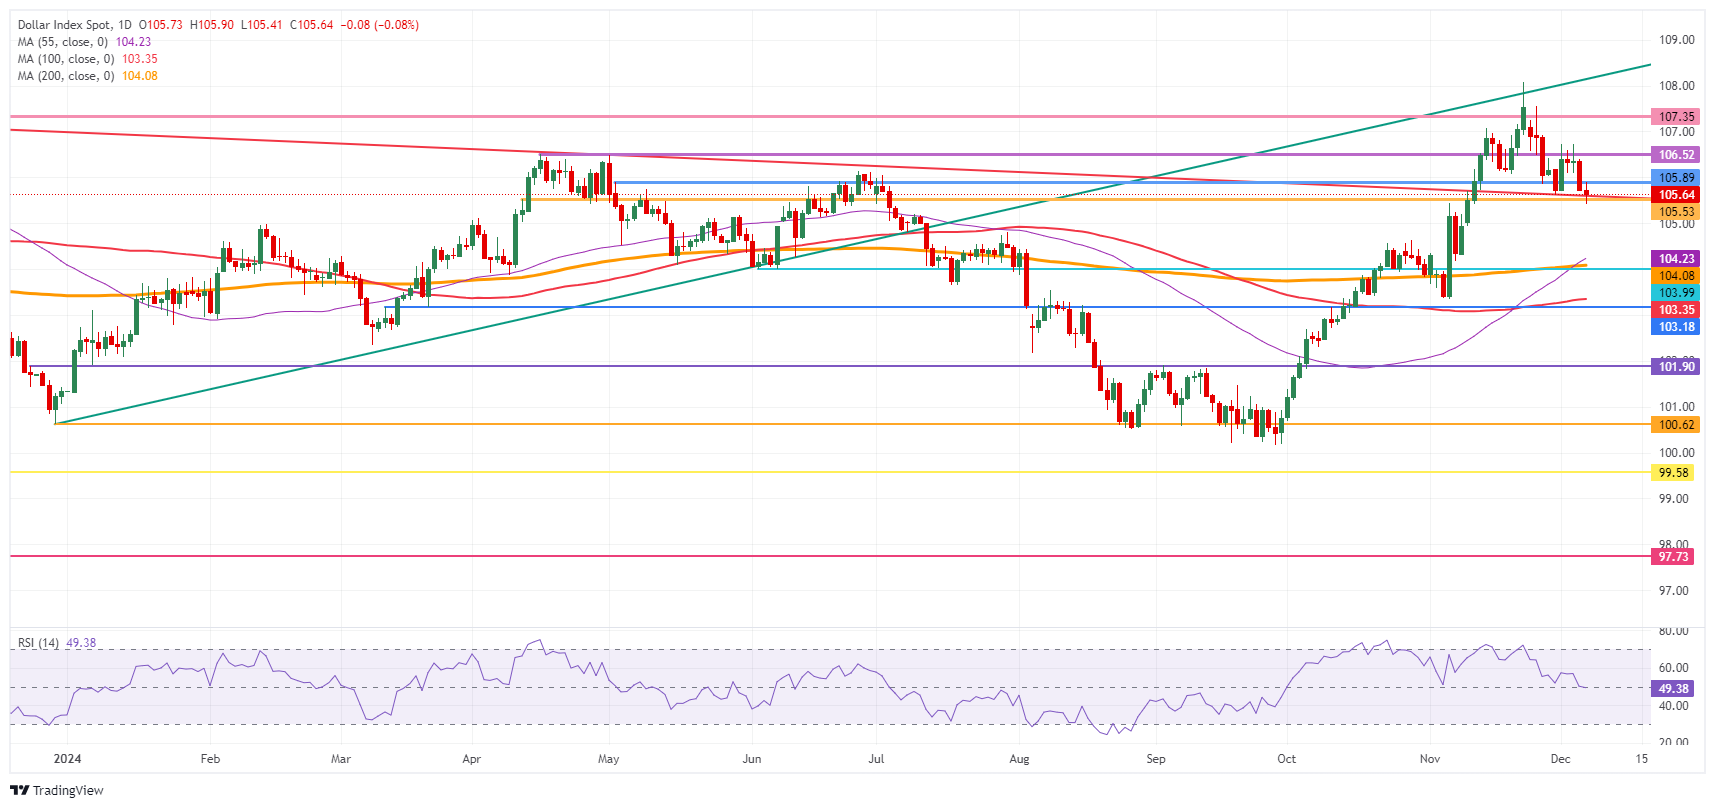
US Dollar Index: Daily Chart
Dot Plot FAQs
The “Dot Plot” is the popular name of the interest-rate projections by the Federal Open Market Committee (FOMC) of the US Federal Reserve (Fed), which implements monetary policy. These are published in the Summary of Economic Projections, a report in which FOMC members also release their individual projections on economic growth, the unemployment rate and inflation for the current year and the next few ones. The document consists of a chart plotting interest-rate projections, with each FOMC member’s forecast represented by a dot. The Fed also adds a table summarizing the range of forecasts and the median for each indicator. This makes it easier for market participants to see how policymakers expect the US economy to perform in the near, medium and long term.
The US Federal Reserve publishes the “Dot Plot” once every other meeting, or in four of the eight yearly scheduled meetings. The Summary of Economic Projections report is published along with the monetary policy decision.
The “Dot Plot” gives a comprehensive insight into the expectations from Federal Reserve (Fed) policymakers. As projections reflect each official’s projection for interest rates at the end of each year, it is considered a key forward-looking indicator. By looking at the “Dot Plot” and comparing the data to current interest-rate levels, market participants can see where policymakers expect rates to head to and the overall direction of monetary policy. As projections are released quarterly, the “Dot Plot” is widely used as a guide to figure out the terminal rate and the possible timing of a policy pivot.
The most market-moving data in the “Dot Plot” is the projection of the federal funds rate. Any change compared with previous projections is likely to influence the US Dollar (USD) valuation. Generally, if the “Dot Plot” shows that policymakers expect higher interest rates in the near term, this tends to be bullish for USD. Likewise, if projections point to lower rates ahead, the USD is likely to weaken.
Author

Filip Lagaart
FXStreet
Filip Lagaart is a former sales/trader with over 15 years of financial markets expertise under its belt.


