US Dollar sees nearly all earlier gains being reversed at start US session
- The US Dollar sees earlier recovery attempt being erased ahead of US cash trading.
- Traders are mulling upcoming comments and announcements from President Trump.
- The US Dollar Index (DXY) trades just above 108.00 and could flip into losses if more selling pressure arises.

The US Dollar Index (DXY), which tracks the Greenback’s value against six major currencies, is seeing earlier attempts to recover from its poor performance on Monday, being erased ahead of fresh comments from President Donald Trump, who is set to make an announcement on infrastructure. The US Dollar received a firm correct on Monday by losing over 1% in the index, when it turned out tariffs were not part of the executive orders signed by Donald Trump in his first hours as US President. Markets got wrong footed thinking the stance on tariffs got eased and would face broad delay.
However, a surprise comment from US President Trump late Monday night triggered a turnaround with reversals in all major pairs, including the US Dollar. President Trump said the application of 25% tariffs on imports from Canada (CAD) and Mexico (MXN) is due at the start of February, with Canadian Dollar (CAD) and Mexican Peso (MXN) devaluing as an immediate reaction. Overall, reversals are taking place on Tuesday from Monday’s losses on nearly all fronts and asset classes impacted by those comments.
Daily digest market movers: Bumpy road ahead
- The US Treasury will publish some data this Tuesday in an otherwise very empty economic calendar ahead. At 16:30 GMT, 3-month, 6-month and 52-week Bills will be allocated in the markets.
- Equities are tying up with gains on Tuesday. European equities are flat, while US futures are up near 0.50%.
- The CME FedWatch tool projects a 54.2% chance that interest rates will remain unchanged at current levels in the May meeting, suggesting a rate cut in June. Expectations are that the Federal Reserve (Fed) will remain data-dependent with uncertainties that could influence inflation during US President Donald Trump’s term.
- The US 10-year yield is trading around 4.57% and has a long road to recover if it wants to head back to last week’s levels near 4.75%.
US Dollar Index Technical Analysis: Recovery squeeze underway
The US Dollar Index (DXY) fell in the hands of the bears on Monday, with the bulls taking over again on Tuesday. However, traders need to be aware of some potholes in the road ahead should the DXY head back to 109.00 and higher. With the ongoing recovery on Tuesday, some pivotal upside levels could cause a heavy rejection, resulting in a dead-cat-bounce, trapping US Dollar bulls and squeezing them out towards 107.00 and lower.
If this recovery wants to continue its ascent, the pivotal level to gain control of is 109.29 (July 14, 2022, high and rising trendline). Further up, the next big upside level to hit before advancing further remains at 110.79 (September 7, 2022, high). Once beyond there, it is quite a stretch to 113.91, a double top from October 2022.
On the downside, the first area to watch is 107.85-107.90, which held Monday’s correction. Further down, the convergence of the high of October 3, 2023, and the 55-day Simple Moving Average (SMA) around 107.35 should act as a double safety feature to catch any falling knive.
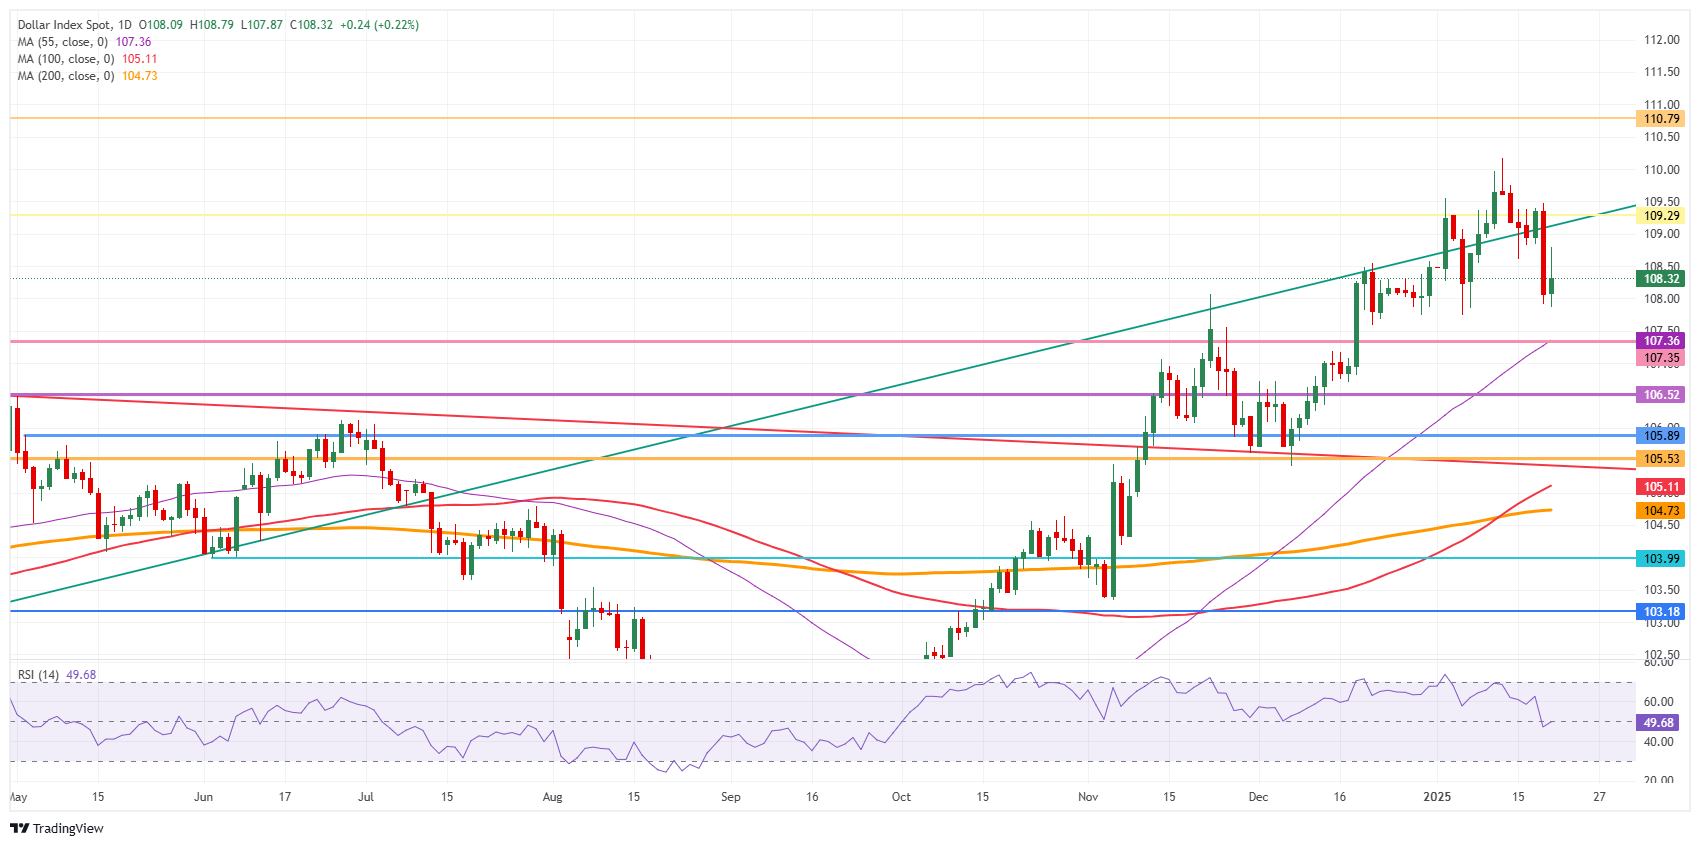
US Dollar Index: Daily Chart
Inflation FAQs
Inflation measures the rise in the price of a representative basket of goods and services. Headline inflation is usually expressed as a percentage change on a month-on-month (MoM) and year-on-year (YoY) basis. Core inflation excludes more volatile elements such as food and fuel which can fluctuate because of geopolitical and seasonal factors. Core inflation is the figure economists focus on and is the level targeted by central banks, which are mandated to keep inflation at a manageable level, usually around 2%.
The Consumer Price Index (CPI) measures the change in prices of a basket of goods and services over a period of time. It is usually expressed as a percentage change on a month-on-month (MoM) and year-on-year (YoY) basis. Core CPI is the figure targeted by central banks as it excludes volatile food and fuel inputs. When Core CPI rises above 2% it usually results in higher interest rates and vice versa when it falls below 2%. Since higher interest rates are positive for a currency, higher inflation usually results in a stronger currency. The opposite is true when inflation falls.
Although it may seem counter-intuitive, high inflation in a country pushes up the value of its currency and vice versa for lower inflation. This is because the central bank will normally raise interest rates to combat the higher inflation, which attract more global capital inflows from investors looking for a lucrative place to park their money.
Formerly, Gold was the asset investors turned to in times of high inflation because it preserved its value, and whilst investors will often still buy Gold for its safe-haven properties in times of extreme market turmoil, this is not the case most of the time. This is because when inflation is high, central banks will put up interest rates to combat it. Higher interest rates are negative for Gold because they increase the opportunity-cost of holding Gold vis-a-vis an interest-bearing asset or placing the money in a cash deposit account. On the flipside, lower inflation tends to be positive for Gold as it brings interest rates down, making the bright metal a more viable investment alternative.
Author

Filip Lagaart
FXStreet
Filip Lagaart is a former sales/trader with over 15 years of financial markets expertise under its belt.


