US Dollar sees US data stalling its Tuesday rally
- The US Dollar gets to keep gains but refrains from adding more.
- US Durable Goods fall below expectations while Richmond Manufacturing remains negative.
- The US Dollar Index (DXY) hitted a fresh weekly high at 108.06 while trying to consolidate above the psychological 108.00 level.

The US Dollar Index (DXY), which tracks the performance of the US Dollar against six different major currencies, orbits around 108.00 throughout the European session and is up over 0.50%. The Nvidia rout from Monday, where Nvidia (NVDA) lost over $600 billion in market capitalization at one point, played into US President Donald Trump’s hand regarding his plan to impose a universal tariff. Markets even got more shaken up when t Trump advocated for a gradually increasing universal tariff plan, bigger than 2.5%.
On the economic data front, all eyes are on the US Federal Reserve (Fed) and the European Central Bank (ECB), which will announce their first monetary policy decisions this year on Wednesday and Thursday, respectively. Ahead of those monetary policy meetings, preliminary reading for the US December Durable Goods was released this Tuesday. A rather big miss on both the Headline and the softer reading without Transportation is limiting more upside in the DXY for now.
Daily digest market movers: US data does not confirm exceptionalism
- Asian markets will quiet down this week and next. With the Lunar New Year starting this Tuesday, Chinese traders will return to the markets on February 5.
- The December US Durable Goods Orders data came in sluggish:
- Headline Durable Goods Orders contracted by -2.2%, failing to match the positive 0.8% estiamte and below the -1.2% from November.
- Durable Goods Orders without Transportation came in at 0.3%, a touch below the 0.4% compared to -0.2% in the previous month.
- The US Conference Board (CB) Consumer Confidence data for January fell to 104.1, below the 105.7 expected and below the previous 104.7. Apart from that, the Richmond Fed Manufacturing Index for January ticked up to -4, beating the -8 and better than the previous -10.
- Equities are seeing their early recovery stall and are falling back to flat after their sharp decline on Monday in the Nvidia (NVDA) rout spillover.
- The CME FedWatch tool projects a 51.2% chance that interest rates will remain unchanged at current levels in the May meeting, with the remaining 48.8% chance of a rate cut that month. Expectations are that the Federal Reserve (Fed) will remain data-dependent with uncertainties that could influence inflation during US President Donald Trump’s term.
- The US 10-year yield is trading around 4.556% and starts its recovery towards the more-than-one-year high seen earlier this month at 4.807%.
US Dollar Index Technical Analysis: Watch out for moves and counter moves
Although the US Dollar Index (DXY) might recover on Tuesday, this does not mean that all downside risk is avoided. Despite its surge back to 108.00, a rejection could occur again, causing the US Dollar Index to fall back to 107.59 or lower. The Relative Strength Index (RSI), which is still below 50, supports that risk possibility as it has more room to move lower before hitting oversold conditions.
The road to recovery is still not done and needs more upside. First, the psychological level of 108.00 must be recovered on a daily close. From there, 109.29 (July 14, 2022, high and rising trendline) is next to pare back last week’s losses. Further up, the next upside level to hit before advancing further remains at 110.79 (September 7, 2022, high).
On the downside, the 55-day Simple Moving Average (SMA) at 107.59 and the October 3, 2023, high at 107.35 acts as a double safety feature to support the DXY price. For now, that looks to be holding, though the Relative Strength Index (RSI) still has some room for the downside. Hence, rather look for 106.52 or even 105.89 as better levels for US Dollar bulls to engage and trigger a reversal.
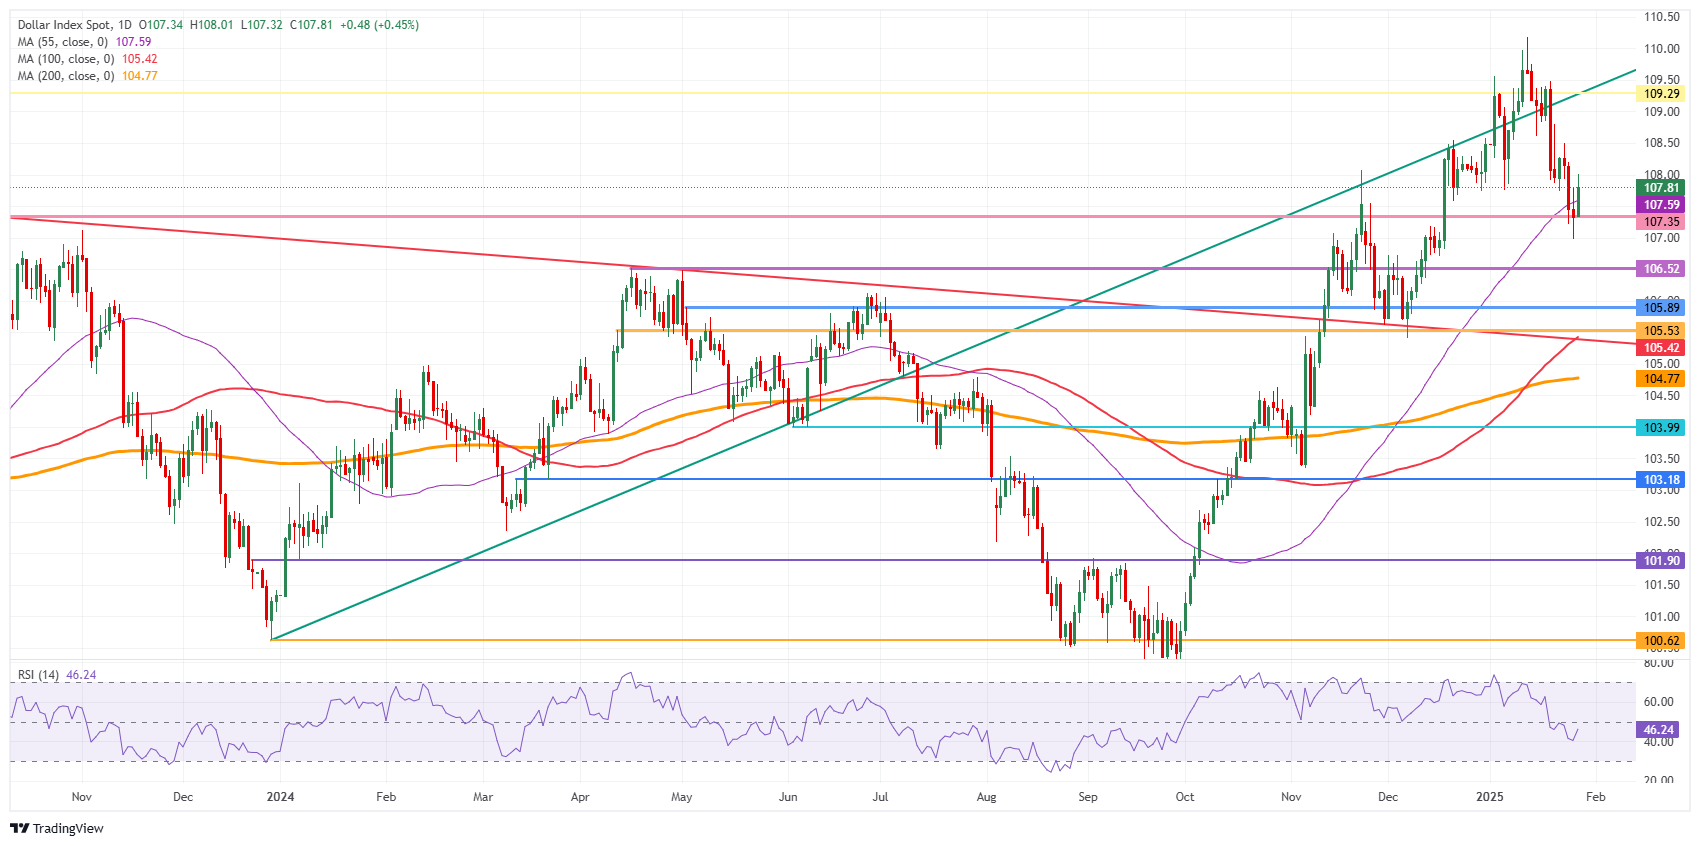
US Dollar Index: Daily Chart
US-China Trade War FAQs
Generally speaking, a trade war is an economic conflict between two or more countries due to extreme protectionism on one end. It implies the creation of trade barriers, such as tariffs, which result in counter-barriers, escalating import costs, and hence the cost of living.
An economic conflict between the United States (US) and China began early in 2018, when President Donald Trump set trade barriers on China, claiming unfair commercial practices and intellectual property theft from the Asian giant. China took retaliatory action, imposing tariffs on multiple US goods, such as automobiles and soybeans. Tensions escalated until the two countries signed the US-China Phase One trade deal in January 2020. The agreement required structural reforms and other changes to China’s economic and trade regime and pretended to restore stability and trust between the two nations. However, the Coronavirus pandemic took the focus out of the conflict. Yet, it is worth mentioning that President Joe Biden, who took office after Trump, kept tariffs in place and even added some additional levies.
The return of Donald Trump to the White House as the 47th US President has sparked a fresh wave of tensions between the two countries. During the 2024 election campaign, Trump pledged to impose 60% tariffs on China once he returned to office, which he did on January 20, 2025. With Trump back, the US-China trade war is meant to resume where it was left, with tit-for-tat policies affecting the global economic landscape amid disruptions in global supply chains, resulting in a reduction in spending, particularly investment, and directly feeding into the Consumer Price Index inflation.
Author

Filip Lagaart
FXStreet
Filip Lagaart is a former sales/trader with over 15 years of financial markets expertise under its belt.


