US Dollar eases after ECB rate cut reveals more issues ahead for the eurozone
- The US Dollar turns softer after the US opening bell on Thursay with the ECB rate cut being digested.
- Markets see PPI and weekly Jobless Claims come in as expected.
- The US Dollar Index eases away from 102.00 and trades in the middle of past week's bandwidth.

The US Dollar (USD) trades softer after the European Central Bank (ECB) has cut its policy rate as expected. The caveat however came with the ECB cutting its growth forecast for every year through 2026. This could mean more rate cuts to come from the ECB, with the rate gap between Europe and the US getting wider, in favor of a stronger US Dollar.
Amidst the ECB rate decision, the US data came in with the Producer Price Index (PPI) falling broadly in line of expectations. The uptick surprise in monthly Core Inflation for the producer side of the economy was broadly offset with downward revisions for the previous month. The Jobless Claims remained steady in both the Initial and the Continuing Claims, supporting the Greenback.
Daily digest market movers: ECB did not paint the brightest picture
- The European Central Bank (ECB) has cut its policy rate by 25 basis points from 3.75% to 3.5%. Devil in the detail came with the slashed growth forecasts that were revised down for every year up and including 2026. Inflation is seen in line of ECB's expectations, which could mean that the ECB will need to cut more then expected in order not stall or see economic growth fall into contraction.
- In the US, Weekly Jobless Claims came out, with Initial Claims coming in at 230,000 from 227,00. Continuing Claims were previously at 1.838 million and ticked up to 1.850 million.
- Together with the weekly Jobless Claims, the Producer Price Index (PPI) for August was released:
- The monthly headline PPI ticked up by 0.2% against 0.0%, and the yearly headline PPI eased to 1.7% from 2.1% a month earlier.
- The monthly core PPI increased by 0.3% after -0.2% the month before, while the yearly core PPI remained steady at 2.4%, as seen in July.
- The US Treasury will swamp the bond market with a 4-week bill auction at 15:30 GMT, and a 30-year bond auction at 17:00 GMT.
- Equities are seeing European equities give up large sums of intraday gains
- The CME Fedwatch Tool shows a 87.0% chance of a 25 basis points (bps) interest rate cut by the Fed on September 18 against a 13.0% chance for a 50 bps cut. For the meeting on November 7, another 25 bps cut (if September is a 25 bps cut) is expected by 49.3%, while there is a 45.0% chance that rates will be 75 bps (25 bps + 50 bps) and a 5.6% probability of rates being 100 (25 bps + 75 bps) basis points lower.
- The US 10-year benchmark rate trades at 3.66%, off the fresh 15-month low at 3.60%.
US Dollar Index Technical Analysis: Fed could be completely different from ECB
The US Dollar Index (DXY) is churning higher this week, testing the higher level of the range it has been trading since the end of August. The level to challenge is 101.90, and it could get broken with some help from the ECB. Seeing the recent weak economic data coming from the Eurozone, the ECB might need to go for more rate cuts to spur the economy. This would widen the rate differential between the US and the Eurozone, resulting. in a stronger US Dollar and a stronger DXY.
The first resistance at 101.90 is getting ready for a third test after its rejection last week and earlier this week. Further up, a steep 1.2% uprising would be needed to get the index to 103.18. The next tranche up is a very misty one, with the 55-day Simple Moving Average (SMA) at 103.40, followed by the 200-day SMA at 103.89, just ahead of the big 104.00 round level.
On the downside, 100.62 (the low from December 28) holds strong and has already made the DXY rebound four times in recent weeks. Should it break, the low from July 14, 2023, at 99.58, will be the ultimate level to look out for. Once that level gives way, early levels from 2023 are coming in near 97.73.
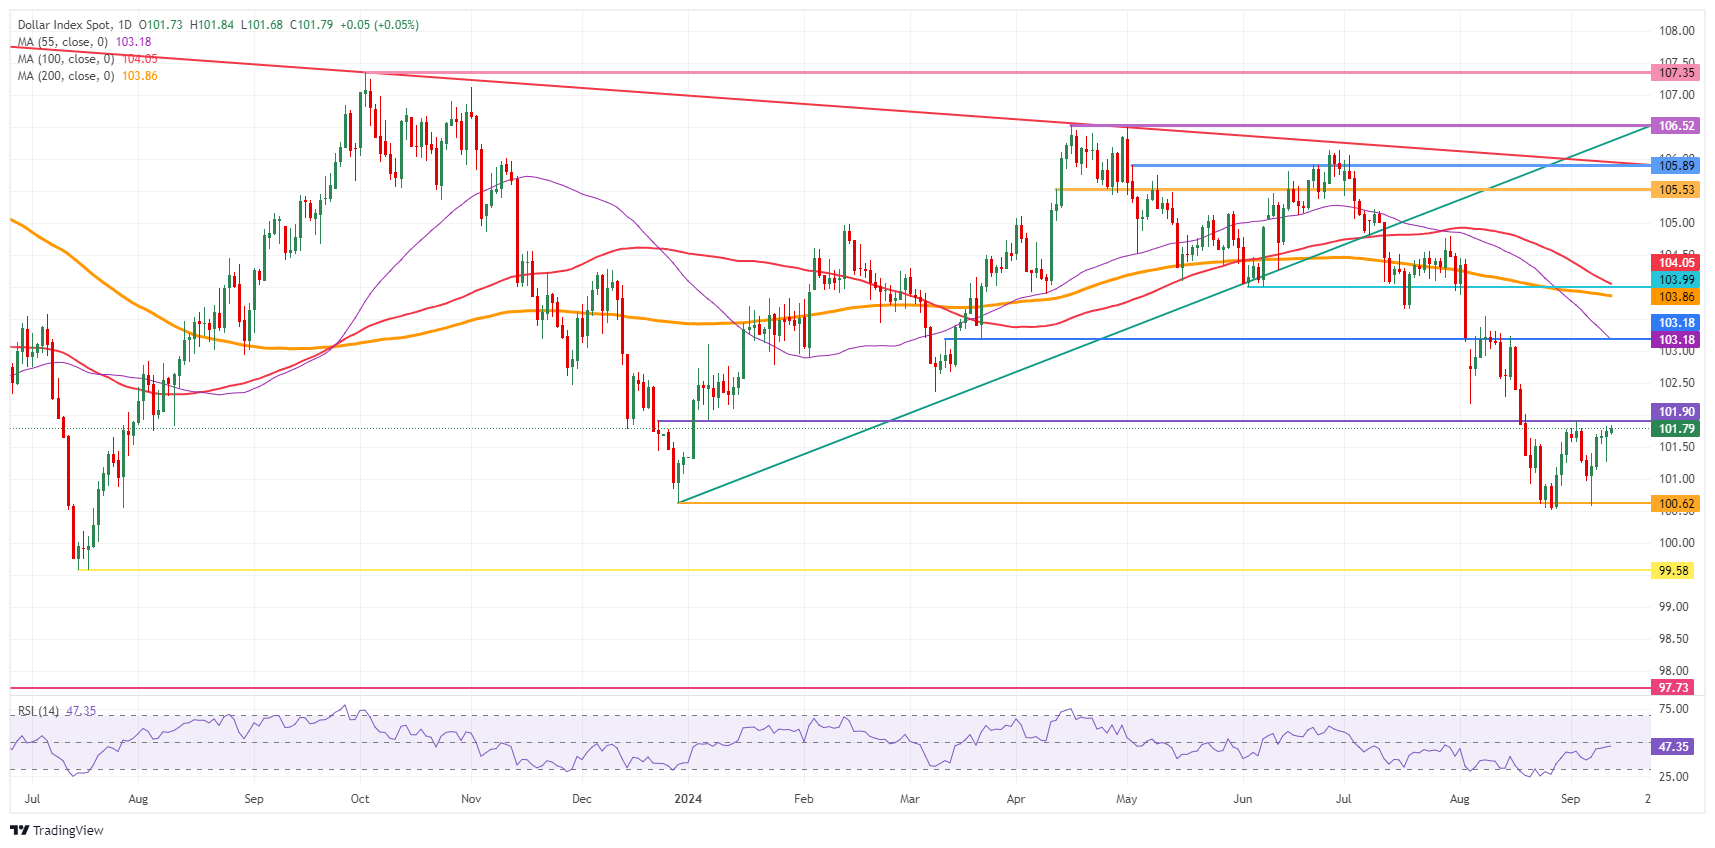
US Dollar Index: Daily Chart
Risk sentiment FAQs
In the world of financial jargon the two widely used terms “risk-on” and “risk off'' refer to the level of risk that investors are willing to stomach during the period referenced. In a “risk-on” market, investors are optimistic about the future and more willing to buy risky assets. In a “risk-off” market investors start to ‘play it safe’ because they are worried about the future, and therefore buy less risky assets that are more certain of bringing a return, even if it is relatively modest.
Typically, during periods of “risk-on”, stock markets will rise, most commodities – except Gold – will also gain in value, since they benefit from a positive growth outlook. The currencies of nations that are heavy commodity exporters strengthen because of increased demand, and Cryptocurrencies rise. In a “risk-off” market, Bonds go up – especially major government Bonds – Gold shines, and safe-haven currencies such as the Japanese Yen, Swiss Franc and US Dollar all benefit.
The Australian Dollar (AUD), the Canadian Dollar (CAD), the New Zealand Dollar (NZD) and minor FX like the Ruble (RUB) and the South African Rand (ZAR), all tend to rise in markets that are “risk-on”. This is because the economies of these currencies are heavily reliant on commodity exports for growth, and commodities tend to rise in price during risk-on periods. This is because investors foresee greater demand for raw materials in the future due to heightened economic activity.
The major currencies that tend to rise during periods of “risk-off” are the US Dollar (USD), the Japanese Yen (JPY) and the Swiss Franc (CHF). The US Dollar, because it is the world’s reserve currency, and because in times of crisis investors buy US government debt, which is seen as safe because the largest economy in the world is unlikely to default. The Yen, from increased demand for Japanese government bonds, because a high proportion are held by domestic investors who are unlikely to dump them – even in a crisis. The Swiss Franc, because strict Swiss banking laws offer investors enhanced capital protection.
Author

Filip Lagaart
FXStreet
Filip Lagaart is a former sales/trader with over 15 years of financial markets expertise under its belt.

















