- US Dollar Index retreats from one-week high, probes four-day uptrend.
- Impending bull cross on the MACD, firmer RSI keeps DXY firmer past 10-DMA.
- Two-month-old support line adds to the downside filters.
US Dollar Index (DXY) buyers take a breather around 113.00, extending a pullback from a one-week high during early Tuesday’s sluggish Asian session. Even so, the sustained trading beyond the short-term moving average and the price-positive signals from the oscillators keep the buyers hopeful.
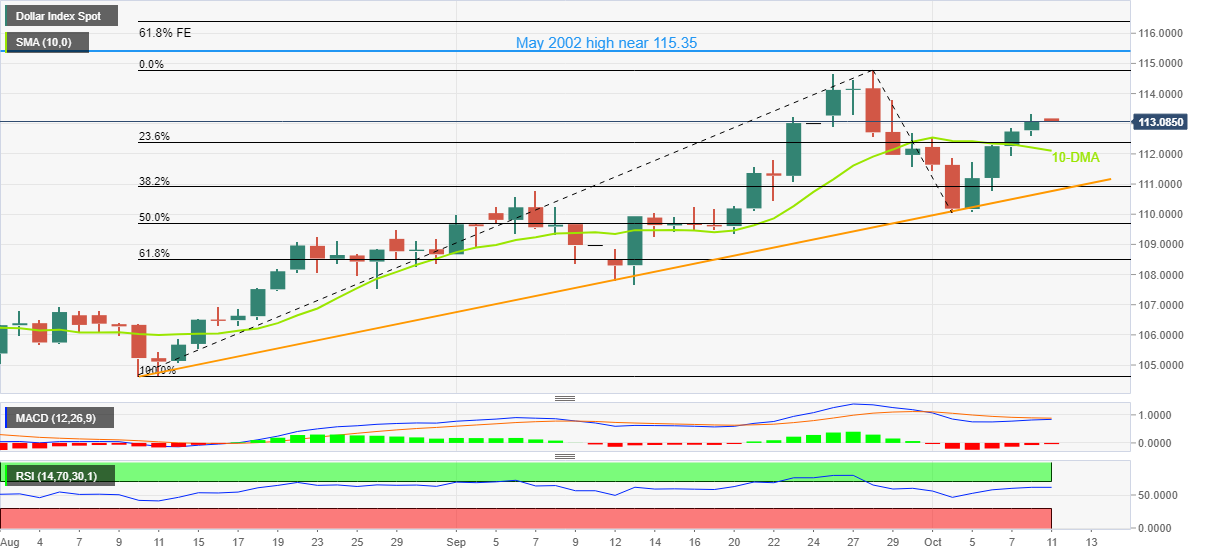
That said, Friday’s upside break of the 10-DMA, around 112.10 by the press time, joins the firmer RSI (14) and the looming bull cross on the MACD to suggest the quote’s additional north run.
It should be noted that the 23.6% Fibonacci retracement level of the DXY’s August-September up-move, around 112.40, acts as immediate support for the greenback’s gauge versus the six major currencies.
Even if the US Dollar Index breaks the 112.40 and 112.10 supports, an upward-sloping support line from early August, around 110.75 at the latest, could challenge the bears.
Alternatively, the 114.00 threshold will precede the recent multi-month high near 114.80 while luring the DXY bulls.
Following that, the May 2002 high near 115.35 and the 61.8% Fibonacci Expansion (FE) of August-October moves, near 116.40, will be in focus.
DXY: Daily chart
Trend: Further upside expected
Information on these pages contains forward-looking statements that involve risks and uncertainties. Markets and instruments profiled on this page are for informational purposes only and should not in any way come across as a recommendation to buy or sell in these assets. You should do your own thorough research before making any investment decisions. FXStreet does not in any way guarantee that this information is free from mistakes, errors, or material misstatements. It also does not guarantee that this information is of a timely nature. Investing in Open Markets involves a great deal of risk, including the loss of all or a portion of your investment, as well as emotional distress. All risks, losses and costs associated with investing, including total loss of principal, are your responsibility. The views and opinions expressed in this article are those of the authors and do not necessarily reflect the official policy or position of FXStreet nor its advertisers. The author will not be held responsible for information that is found at the end of links posted on this page.
If not otherwise explicitly mentioned in the body of the article, at the time of writing, the author has no position in any stock mentioned in this article and no business relationship with any company mentioned. The author has not received compensation for writing this article, other than from FXStreet.
FXStreet and the author do not provide personalized recommendations. The author makes no representations as to the accuracy, completeness, or suitability of this information. FXStreet and the author will not be liable for any errors, omissions or any losses, injuries or damages arising from this information and its display or use. Errors and omissions excepted.
The author and FXStreet are not registered investment advisors and nothing in this article is intended to be investment advice.
Recommended content
Editors’ Picks
AUD/USD failed just ahead of the 200-day SMA
Finally, AUD/USD managed to break above the 0.6500 barrier on Wednesday, extending the weekly recovery, although its advance faltered just ahead of the 0.6530 region, where the key 200-day SMA sits.
EUR/USD met some decent resistance above 1.0700
EUR/USD remained unable to gather extra upside traction and surpass the 1.0700 hurdle in a convincing fashion on Wednesday, instead giving away part of the weekly gains against the backdrop of a decent bounce in the Dollar.
Gold keeps consolidating ahead of US first-tier figures
Gold finds it difficult to stage a rebound midweek following Monday's sharp decline but manages to hold above $2,300. The benchmark 10-year US Treasury bond yield stays in the green above 4.6% after US data, not allowing the pair to turn north.
Bitcoin price could be primed for correction as bearish activity grows near $66K area
Bitcoin (BTC) price managed to maintain a northbound trajectory after the April 20 halving, despite bold assertions by analysts that the event would be a “sell the news” situation. However, after four days of strength, the tables could be turning as a dark cloud now hovers above BTC price.
Bank of Japan's predicament: The BOJ is trapped
In this special edition of TradeGATEHub Live Trading, we're joined by guest speaker Tavi @TaviCosta, who shares his insights on the Bank of Japan's current predicament, stating, 'The BOJ is Trapped.'