US Dollar rolls through markets ahead of NFP on Friday
- The US Dollar gains further after former NY Fed President Dudley commented on Fed rate cut path.
- Reports are coming in from explosions being heard in Beirut.
- The US Dollar Index tests the upper band of its September range for a potential breakout later this Thursday.

The US Dollar (USD) is trading higher just ahead of the US trading session after former president of Federal Reserve Bank of New York William Dudley comment on Bloomberg television on the current situation for the Federal Reserve. Former Fed's Dudley said with these economic numbers, a 25 basis point rate cut is the only healthy way forward. This diminishes chances of another large interest-rate cut by the US Federal Reserve (Fed) in November.
The US Dollar already received a nudge higher this Thursday in Asian trading after new prime minister Shigeru Ishiba said on Wednesday that the economy isn’t ready for another interest-rate increase, sending the JPY lower. The turmoil in Lebanon is also underpinning the Greenback with safe-haven inflows.
The economic calendar is ready for another very full day. Besides the weekly Jobless Claims which already came in quite steady at 225,000, markets brace for the S&P Global Services Purchasing Managers index and the Institute for Supply Management (ISM) September numbers.
Daily digest market movers: Data driven drives US Dollar higher
- New Japanese prime minister Shigeru Ishiba said on Wednesday the economy isn’t ready for another interest-rate increase, sending the yen lower, Bloomberg reported. Bank of Japan (BoJ) board member Asahi Noguchi was quick to comment that markets should not respond to each comment politicians make.
- There were surprising comments as well from Bank of England (BoE) Governor Andrew Bailey, who said to the Guardian newspaper that the BoE might need to start cutting soon and aggressively, Bloomberg reports.
- The US economic calendar started early with the Challenger Job Cuts data for September. Around 72,821 jobs were cut against the 75,891 layoffs in August .
- At 12:30 GMT, the weekly Jobless Claims were due, with Initial Claims coming in at 225,000, a touch higher than the expected 22,000 and above the revised 219,000 from 218,000. Continuing Claims fell from 1.827 million to 1.826 million.
- Around 13:45 GMT, the final S&P Global Services Purchasing Managers Index (PMI) for September came in at 55.2 against the expected 55.4. The Composite PMI fell to 54.0, coming from 54.4.
- The Institute for Supply Management (ISM) has release its September numbers for the Services sector:
- The headline PMI jumped to 54.9 against the 51.5 a month earlier. Expectation was for a 51.7.
- As for the main subindexes, Employment was at 50.2 in August and fell to 48.1 in September, New Orders jumped to 59.4 against 53 previously, while Prices Paid jumped to 59.4, from 57.3.
- At 14:40 GMT, Federal Reserve Bank of Atlanta Raphael Bostic participates in a discussion with Minneapolis Fed President Neel Kashkari as part of the Opportunity and Growth Institute's 2024 Fall Research Conference.
- European equities are still in the red, though off the lows for this Thursday. US futures are trading at a minor loss for this Thursday.
- The CME Fedwatch Tool shows a 67.4% chance of a 25 basis-point rate cut at the next Fed meeting on November 7, while 32.6% is pricing in another 50-basis-point rate cut.
- The US 10-year benchmark rate trades at 3.83%, printing a fresh three-week high.
US Dollar Index Technical Analysis: DXY breaks out
The US Dollar Index (DXY) has made a stellar recovery this week, though be it with a bit of outside help. With the DXY now hitting the upper cap at 101.90, risk could take place that a rejection takes place, with the DXY unable to break above the September range. Ideally, the DXY would be able to remain around these levels and have the Nonfarm Payrolls number as a catalyst to either push the DXY higher or send it back lower towards the lower end of this month.
The recovery has performed well and could be facing the end of the line for now. expect this September high at 101.90 to remain the first resistance level on the upside for now. Just above there, the 55-day Simple Moving Average (SMA) at 102.09 will come in. A leg higher the chart identifies 103.18 as the very final level for this week on the upside.
On the downside, 100.62 is flipping back from resistance into support in case the DXY closes above it this Tuesday. The fresh low of 2024 is at 100.16, so a test will take place before more downside takes place. Further down, and that means giving up the big 100.00 level, the July 14, 2023, low at 99.58 comes into play.
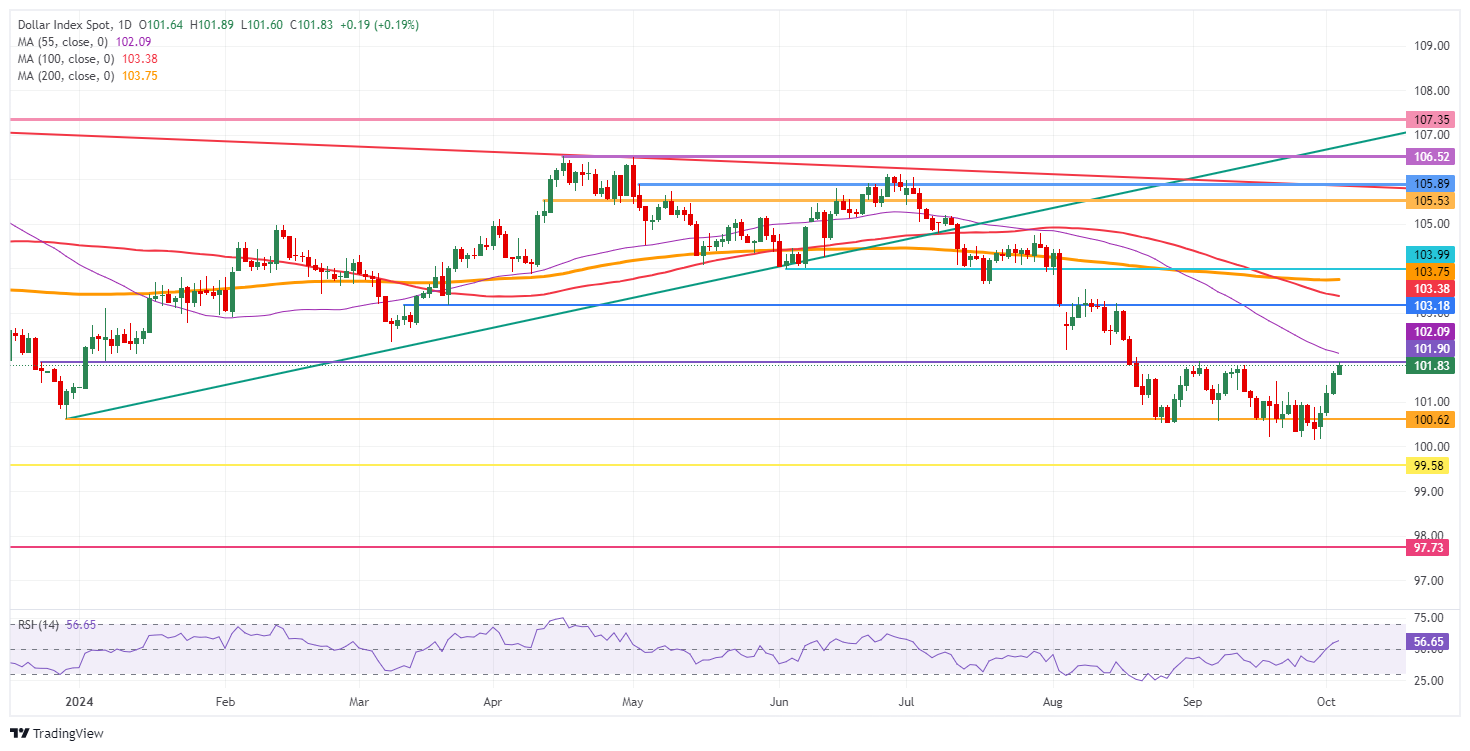
US Dollar Index: Daily Chart
Dot Plot FAQs
The “Dot Plot” is the popular name of the interest-rate projections by the Federal Open Market Committee (FOMC) of the US Federal Reserve (Fed), which implements monetary policy. These are published in the Summary of Economic Projections, a report in which FOMC members also release their individual projections on economic growth, the unemployment rate and inflation for the current year and the next few ones. The document consists of a chart plotting interest-rate projections, with each FOMC member’s forecast represented by a dot. The Fed also adds a table summarizing the range of forecasts and the median for each indicator. This makes it easier for market participants to see how policymakers expect the US economy to perform in the near, medium and long term.
The US Federal Reserve publishes the “Dot Plot” once every other meeting, or in four of the eight yearly scheduled meetings. The Summary of Economic Projections report is published along with the monetary policy decision.
The “Dot Plot” gives a comprehensive insight into the expectations from Federal Reserve (Fed) policymakers. As projections reflect each official’s projection for interest rates at the end of each year, it is considered a key forward-looking indicator. By looking at the “Dot Plot” and comparing the data to current interest-rate levels, market participants can see where policymakers expect rates to head to and the overall direction of monetary policy. As projections are released quarterly, the “Dot Plot” is widely used as a guide to figure out the terminal rate and the possible timing of a policy pivot.
The most market-moving data in the “Dot Plot” is the projection of the federal funds rate. Any change compared with previous projections is likely to influence the US Dollar (USD) valuation. Generally, if the “Dot Plot” shows that policymakers expect higher interest rates in the near term, this tends to be bullish for USD. Likewise, if projections point to lower rates ahead, the USD is likely to weaken.
Author

Filip Lagaart
FXStreet
Filip Lagaart is a former sales/trader with over 15 years of financial markets expertise under its belt.















