|

Silver rallies to a new high for 2024

  • Silver breaks to a new high for the year and a 12-year high for the precious metal overall. 
  • The news of another stimulus package from the Chinese government helped push up the commodity. 
  • The escalating conflict in the Middle East and expectations of aggressive Fed easing further propel Silver.

Silver (XAG/USD) breaks to a new high for 2024 and a 12-year high overall on Thursday, after the Chinese authorities announced another 1 trillion CNY of extra stimulus on top of the package of measures already proposed by the People’s Bank of China (PBoC). China is the largest consumer of Silver in the world so the stimulus is expected to increase demand for the commodity. 

Silver also saw gains from the escalation of the conflict in the Middle East between Israel and Hezbollah, and continued bets the Federal Reserve (Fed) will cut its key fed funds rate by another half a percent at its November meeting. Lower interest rates are positive for Silver because they increase the attractiveness of the non-interest bearing asset. 

Technical Analysis: Silver breaks above key trendline and rallies 

Silver has broken decisively above a key trendline and escaped from the range it was trapped in since May 2024. 

It is now in an established short and medium-term uptrend and given “the trend is your friend” according to technical analysis theory, the odds favor an extension higher. 

Silver Daily Chart


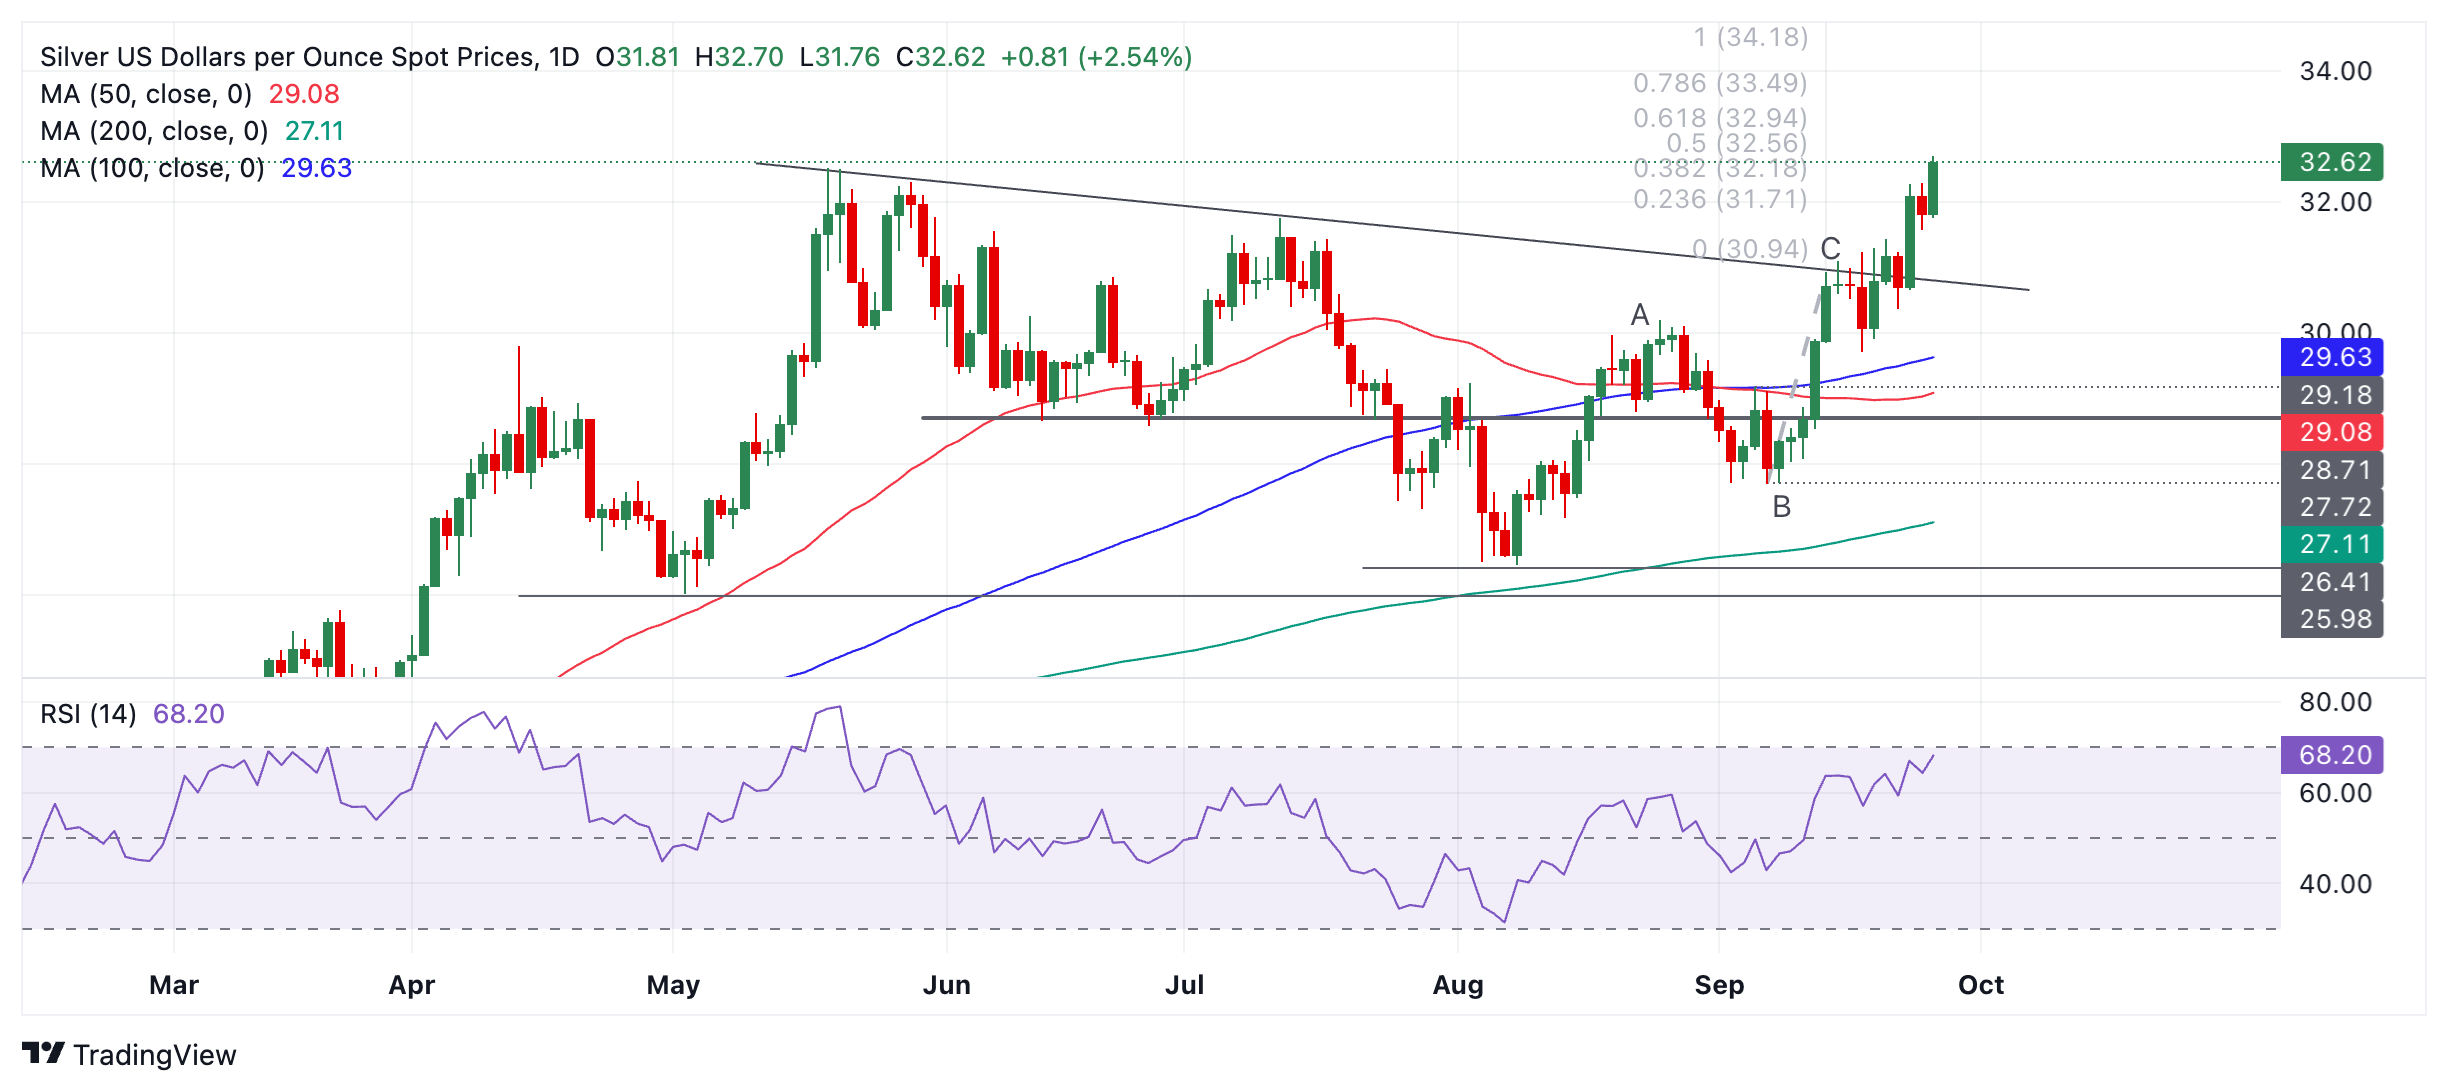
The next target on the radar is $32.94, the 0.618 Fibonacci ratio extrapolation of the C wave of the Measured Move pattern outlined prior to the breakout above the trendline. A really bullish move could eventually reach $34.18, the 100% extrapolation of wave C. 

The Relative Strength Index (RSI) momentum gauge is not yet overbought, indicating there is probably more upside left in the market.

Author

Joaquin Monfort

Joaquin Monfort is a financial writer and analyst with over 10 years experience writing about financial markets and alt data. He holds a degree in Anthropology from London University and a Diploma in Technical analysis.

More from Joaquin Monfort
Share:

Editor's Picks

AUD/USD falls to near 0.7100 after slipping below 50-day EMA

AUD/USD depreciates after registering minor gains in the previous day, trading around 0.7120 during the Asian hours. The technical analysis of the daily chart shows the pair consolidating sideways within a rectangle pattern, as neither bulls nor bears gain control. The AUD/USD pair is holding a slight bearish tone however as it sits beneath both the nine-day and 50-day EMAs.

Japanese Yen edges up but remains close to the 160.00 intervention threshold

The Japanese Yen edges up against the US Dollar on Friday, but the USD/JPY pair remains above 159.90 at the time of writing, unable to put a significant distance from the 160.00 level, considered the limit of tolerable JPY weakness for Japanese authorities.

Gold returns to the red, awaits US NFP

Gold price is looking to test the weekly lows, while in the red near $4,450 in the early European session on Friday. The precious metal remains vulnerable amid ongoing geopolitical turmoil. Traders will closely monitor the developments surrounding the US-Iran peace deal and the US May employment report later on Friday.


Indian Rupee jumps as RBI holds, but unveils measures to boost foreign inflows

The Reserve Bank of India held the Repo Rate at 5.25%, as widely expected, on Friday. But the central bank unveiled various measures to boost foreign inflows into the economy, lifting the Indian Rupee against the US Dollar.

Top 3 Price Prediction: Bitcoin eyes $60,000, Ethereum risks $1,750, XRP could test $1

Bitcoin, Ethereum, and Ripple prices edge lower on Friday, extending a steady decline of roughly 15% so far this week. Institutional outflows weigh on Bitcoin and Ethereum while XRP largely follows the broader market trend.

Recession on paper: What really moves the Canadian Loonie now?

Statistics Canada handed the headline writers a gift and the analysts a headache. Real GDP shrank 0.1% on an annualized basis in the first quarter, and with the fourth quarter of 2025 revised down to a 1.0% contraction, that is two negative quarters in a row, the textbook definition of a technical recession and Canada's first since the pandemic.