Silver Price Prediction: XAG/USD sticks to modest gains near $27.65-70 area, 23.6% Fibo.


  • Silver attracts buyers for the second straight day and moves away from a multi-month low.
  • The technical setup supports prospects for the emergence of fresh selling at higher levels. 
  • A sustained move beyond the 100-day SMA and $29.00 is needed to negate the bearish bias.

Silver (XAG/USD) builds on the overnight goodish rebound from the $26.45 area, or a three-month low and scales higher for the second successive day on Friday. The white metal climbs to a four-day peak, around the $27.75 region during the Asian session, though the positive momentum runs the risk of fizzling out rather quickly. 

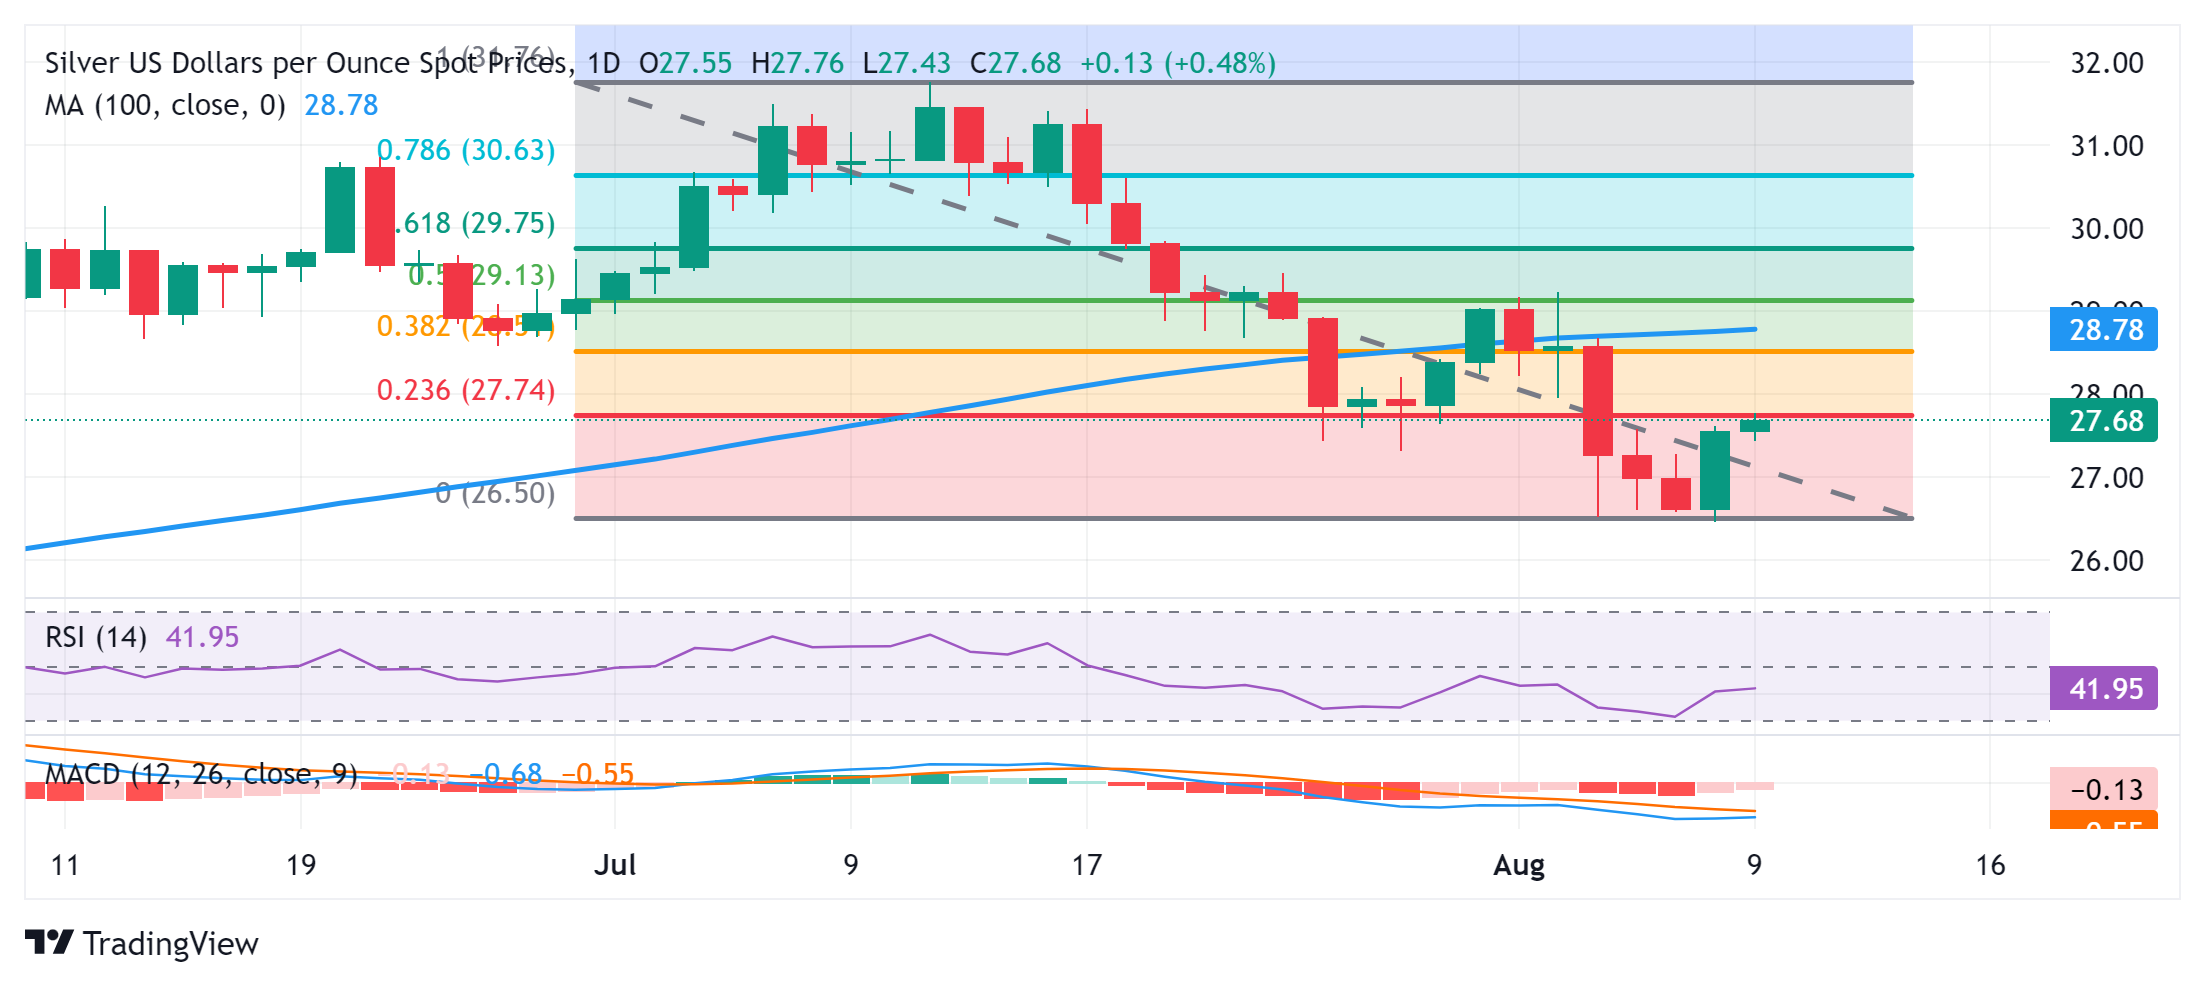
From a technical perspective, the XAG/USD pauses near the 23.6% Fibonacci retracement level of the July-August downfall. The said barrier should now act as a key pivotal point, which if cleared might trigger a short-covering rally and lift the XAG/USD beyond the $28.00 mark, towards the 38.2% Fibo. level around the $28.50-$28.55 region. That said, oscillators on the daily chart – though have recovered from lower levels – are still holding deep in negative territory. 

Hence, any further move up is likely to confront stiff resistance and remain capped near the 100-day Simple Moving Average (SMA) support breakpoint, around the $28.75-$28.80 zone. This is followed by the $29.00 mark, which if cleared decisively will negate the negative outlook. The XAG/USD might then climb to the $29.45 intermediate hurdle en route to the 61.8% Fibo. level, around the $29.75 region and eventually aim to reclaim the $30.00 psychological mark.

On the flip side, the $27.30-$27.25 area now seems to protect the immediate downside ahead of the $27.00 mark. Any further decline might continue to find strong support near the $26.50-$26.45 area, or a multi-month low touched on Wednesday. Some follow-through selling, however, will be seen as a fresh trigger for bears and drag the XAG/USD to the May monthly swing low, around the $26.00 mark. The next relevant support is pegged near the $25.60 horizontal zone, below which the commodity could fall to the $25.00 psychological mark.

Silver daily chart

fxsoriginal

Silver FAQs

Silver is a precious metal highly traded among investors. It has been historically used as a store of value and a medium of exchange. Although less popular than Gold, traders may turn to Silver to diversify their investment portfolio, for its intrinsic value or as a potential hedge during high-inflation periods. Investors can buy physical Silver, in coins or in bars, or trade it through vehicles such as Exchange Traded Funds, which track its price on international markets.

Silver prices can move due to a wide range of factors. Geopolitical instability or fears of a deep recession can make Silver price escalate due to its safe-haven status, although to a lesser extent than Gold's. As a yieldless asset, Silver tends to rise with lower interest rates. Its moves also depend on how the US Dollar (USD) behaves as the asset is priced in dollars (XAG/USD). A strong Dollar tends to keep the price of Silver at bay, whereas a weaker Dollar is likely to propel prices up. Other factors such as investment demand, mining supply – Silver is much more abundant than Gold – and recycling rates can also affect prices.

Silver is widely used in industry, particularly in sectors such as electronics or solar energy, as it has one of the highest electric conductivity of all metals – more than Copper and Gold. A surge in demand can increase prices, while a decline tends to lower them. Dynamics in the US, Chinese and Indian economies can also contribute to price swings: for the US and particularly China, their big industrial sectors use Silver in various processes; in India, consumers’ demand for the precious metal for jewellery also plays a key role in setting prices.

Silver prices tend to follow Gold's moves. When Gold prices rise, Silver typically follows suit, as their status as safe-haven assets is similar. The Gold/Silver ratio, which shows the number of ounces of Silver needed to equal the value of one ounce of Gold, may help to determine the relative valuation between both metals. Some investors may consider a high ratio as an indicator that Silver is undervalued, or Gold is overvalued. On the contrary, a low ratio might suggest that Gold is undervalued relative to Silver.


Share: Feed news

Information on these pages contains forward-looking statements that involve risks and uncertainties. Markets and instruments profiled on this page are for informational purposes only and should not in any way come across as a recommendation to buy or sell in these assets. You should do your own thorough research before making any investment decisions. FXStreet does not in any way guarantee that this information is free from mistakes, errors, or material misstatements. It also does not guarantee that this information is of a timely nature. Investing in Open Markets involves a great deal of risk, including the loss of all or a portion of your investment, as well as emotional distress. All risks, losses and costs associated with investing, including total loss of principal, are your responsibility. The views and opinions expressed in this article are those of the authors and do not necessarily reflect the official policy or position of FXStreet nor its advertisers. The author will not be held responsible for information that is found at the end of links posted on this page.

If not otherwise explicitly mentioned in the body of the article, at the time of writing, the author has no position in any stock mentioned in this article and no business relationship with any company mentioned. The author has not received compensation for writing this article, other than from FXStreet.

FXStreet and the author do not provide personalized recommendations. The author makes no representations as to the accuracy, completeness, or suitability of this information. FXStreet and the author will not be liable for any errors, omissions or any losses, injuries or damages arising from this information and its display or use. Errors and omissions excepted.

The author and FXStreet are not registered investment advisors and nothing in this article is intended to be investment advice.

XM
Account
7.2
Tools
9.2
Service
9.4
Trading
9.0
Trust
7.0
Experience
8.4
Read review
Moneta Markets
Account
7.4
Tools
6.6
Service
8.0
Trading
6.6
Trust
5.2
Experience
9.2
Read review
Trading Pro
Account
7.2
Tools
5.2
Service
6.6
Trading
8.0
Trust
5.0
Experience
7.0
Read review
Pepperstone
Account
8.2
Tools
8.2
Service
7.4
Trading
9.0
Trust
8.8
Experience
9.0
Read review
XM
Read review
Moneta Markets
Read review
Trading Pro
Read review
Pepperstone
Read review
Trading Pro
Read review
Pepperstone
Read review
XM
Read review
Moneta Markets
Read review
Trading Pro
Account
7.2
Tools
5.2
Service
6.6
Trading
8.0
Trust
5.0
Experience
7.0
Read review
Pepperstone
Account
8.2
Tools
8.2
Service
7.4
Trading
9.0
Trust
8.8
Experience
9.0
Read review
XM
Account
7.2
Tools
9.2
Service
9.4
Trading
9.0
Trust
7.0
Experience
8.4
Read review
Moneta Markets
Account
7.4
Tools
6.6
Service
8.0
Trading
6.6
Trust
5.2
Experience
9.2
Read review

Recommended content


Recommended content

Editors’ Picks

EUR/USD dips below 1.1000 as Trump authorizes 90-day pause on tariffs

EUR/USD dips below 1.1000 as Trump authorizes 90-day pause on tariffs

EUR/USD retreated below the 1.1000 mark on headlines indicating that United States President Donald Trump authorized a 90-day pause on non-retaliating countries. The pause applies to reciprocal and 10% tariffs, effective immediately, according to a Truth Social post. FOMC Minutes coming up next.


EUR/USD News
GBP/USD eases further on tariffs pause announcement, USD still weak

GBP/USD eases further on tariffs pause announcement, USD still weak

GBP/USD's correction seems to have met a decent contention around the 1.2750 zone so far on Wednesday, as investors continue to assess the ongoing US-China trade war ahead of the release of the FOMC Minutes. Pause in 10% and reciprocal tariffs lifted the mood. 

GBP/USD News
Gold recedes to $3,050 on Trump's headlines

Gold recedes to $3,050 on Trump's headlines

Gold prices now give away part of their advance and revisit the $3,050 zone per troy ounce after President Trump announced a 90-day pause on reciprocal and 10% tariffs.

Gold News
Fed Minutes to offer clues on rate cut outlook amid tariff uncertainty

Fed Minutes to offer clues on rate cut outlook amid tariff uncertainty

The eagerly awaited minutes from the US Fed’s March 18-19 monetary policy meeting are set for release on Wednesday at 18:00 GMT. During the gathering, policymakers agreed to keep the Fed Funds Target Range (FFTR) unchanged at 4.25%-4.50%.

Read more
Tariff rollercoaster continues as China slapped with 104% levies

Tariff rollercoaster continues as China slapped with 104% levies

The reaction in currencies has not been as predictable. The clear winners so far remain the safe-haven Japanese yen and Swiss franc, no surprises there, while the euro has also emerged as a quasi-safe-haven given its high liquid status.

Read more
The Best brokers to trade EUR/USD

The Best brokers to trade EUR/USD

SPONSORED Discover the top brokers for trading EUR/USD in 2025. Our list features brokers with competitive spreads, fast execution, and powerful platforms. Whether you're a beginner or an expert, find the right partner to navigate the dynamic Forex market.

Read More

Forex MAJORS

Cryptocurrencies

Signatures

Best Brokers of 2025