|

Silver Price Forecast: XAG/USD tumbles to $30.30 as US Dollar remains firm ahead of US PMI

  • Silver price declines to $30.30 amid firm US Dollar.
  • Investors await the preliminary US S&P Global PMI report for June.
  • The Fed is expected to cut interest rates twice this year.

Silver price (XAG/USD) falls sharply to near $30.30 in Friday’s American session. The white metal is under pressure as the US Dollar (USD) clings to gains ahead of the preliminary United States (US) S&P PMI data for June, which will be published at 13:45 GMT.

The US Dollar Index (DXY) rises to a six-week high around 105.90 as global PMI figures have failed to meet market estimates, resulting in a dismal market sentiment. The USD Index could face pressure if the US PMI data also fails to match expectations.

Economists expect that the PMI report will show a slower growth in the Manufacturing as well as in Services activity.

Meanwhile, the overall appeal of the Silver price remains upbeat as investors expect that the Fed will start reducing interest rates from the September meeting. Financial markets expect that the Fed will deliver two rate cuts this year instead of one as signaled by policymakers in their latest interest rate projections report.

The expectations for the Fed reducing rates twice this year were prompted by soft US inflation report and slower than-expected growth in Retail Sales data for May. On the inflation outlook, Minneapolis Fed Bank President Neel Kashkari said on Thursday that inflation would return to bank’s target of 2% in up to two years. However, Kashkari remained concerned about high wage growth.

Silver technical analysis

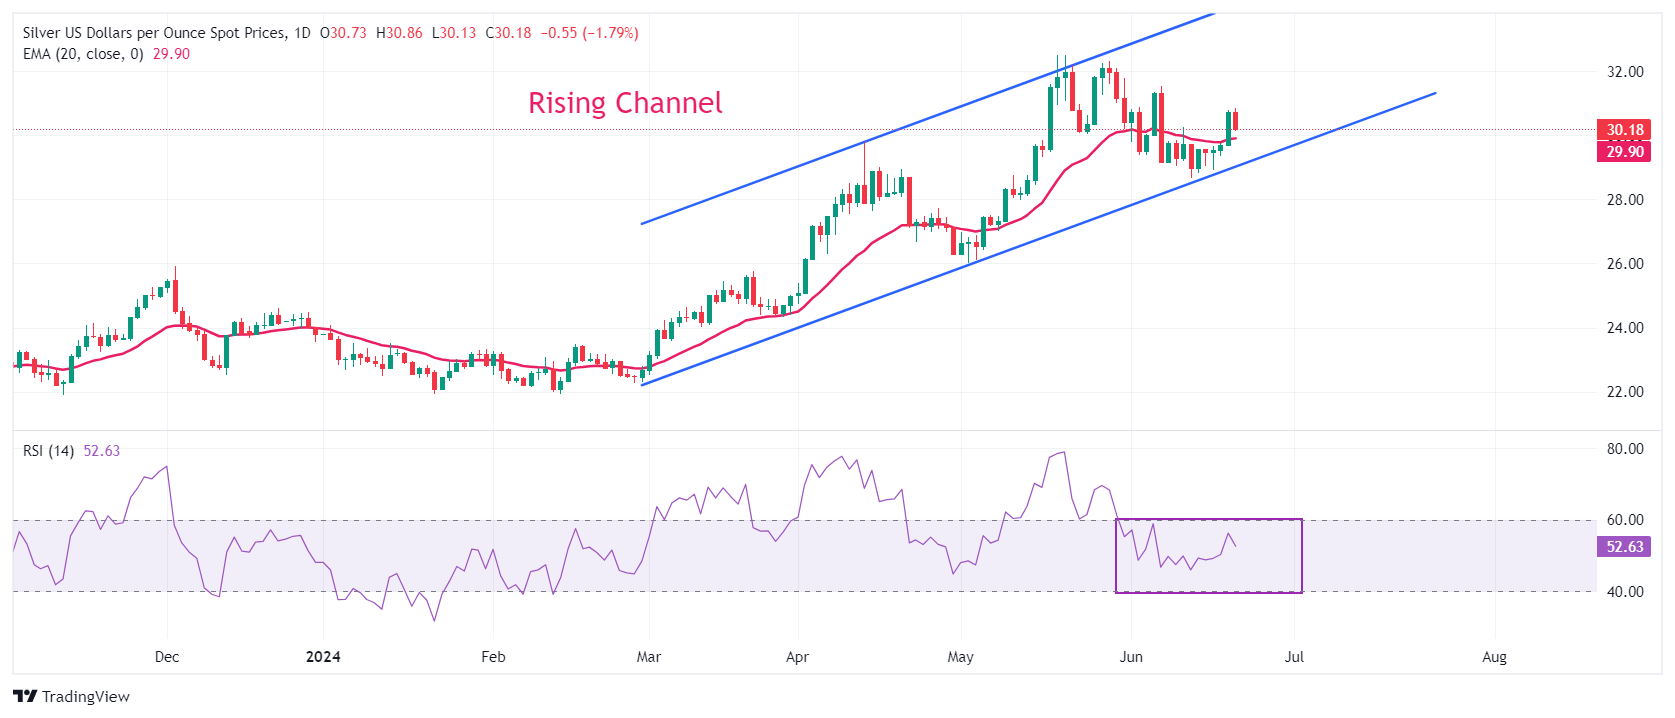
Silver price rebounds after discovering buying interest near the lower border of the Rising Channel chart pattern formed on a daily timeframe. The white metal rises above the 20-day Exponential Moving Average (EMA) near $29.90, suggesting that the near-term trend has turned bullish.

The 14-period Relative Strength Index (RSI) oscillates in the 40.00-60.00 range, indicating indecisiveness among investors.

Silver daily chart

XAG/USD

Overview
Today last price30.17
Today Daily Change-0.56
Today Daily Change %-1.82
Today daily open30.73
 
Trends
Daily SMA2030.26
Daily SMA5029.11
Daily SMA10026.68
Daily SMA20024.92
 
Levels
Previous Daily High30.79
Previous Daily Low29.71
Previous Weekly High30.26
Previous Weekly Low28.66
Previous Monthly High32.51
Previous Monthly Low26.02
Daily Fibonacci 38.2%30.38
Daily Fibonacci 61.8%30.12
Daily Pivot Point S130.03
Daily Pivot Point S229.33
Daily Pivot Point S328.95
Daily Pivot Point R131.11
Daily Pivot Point R231.49
Daily Pivot Point R332.2

Author

Sagar Dua

Sagar Dua

FXStreet

Sagar Dua is associated with the financial markets from his college days. Along with pursuing post-graduation in Commerce in 2014, he started his markets training with chart analysis.

More from Sagar Dua
Share:

Editor's Picks

AUD/USD eyes 0.7150 barrier nine-day EMA

AUD/USD inches higher after registering modest losses in the previous day, trading around 0.7130 during the Asian hours. The technical analysis of the daily chart indicates that the pair is moving sideways within the rectangle pattern, suggesting a consolidation as neither the bulls nor the bears have enough momentum to take control of the market.

USD/JPY trades below 160.00 intervention threshold; bullish bias intact

The USD/JPY pair attracts some sellers during the Asian session amid fears that authorities will step in again to prop up the Japanese Yen. Furthermore, the Israel-Lebanon truce prompts some profit-taking around the US Dollar and exerts downward pressure on the currency pair.

Gold puts its 200-day SMA to the test near $4,420

Gold keeps the bullish stance in place in the latter part of Thursday’s session, although a convincing break above the key $4,500 mark per troy ounce still remains elusive. The precious metal’s advance comes amid the resurgence of some selling interest around the Greenback, improving risk sentiment, and declining US Treasury yields across the board.

Bitcoin’s massive storm is back: Why the sell-off is far from over

Bitcoin price action over the last few weeks has felt less like a normal, healthy correction and more like a slow grinding crash that continues to wreak havoc on holdings and trading accounts. And everything suggests that the dramatic crash isn’t over.

Nonfarm payrolls: Testing the limits of Fed policy patience

The upcoming nonfarm payrolls report for May will provide the final update on the US labor market before Kevin Warsh attends his first policy meeting as the new Fed Chair later this month.

Recession on paper: What really moves the Canadian Loonie now?

Statistics Canada handed the headline writers a gift and the analysts a headache. Real GDP shrank 0.1% on an annualized basis in the first quarter, and with the fourth quarter of 2025 revised down to a 1.0% contraction, that is two negative quarters in a row, the textbook definition of a technical recession and Canada's first since the pandemic.