Silver Price Forecast: XAG/USD slumps to near $29.60 despite geopolitical tensions
- Silver price drops sharply to near $29.60 as US bond yields rise on expectations that the Fed will follow gradual rate-cut cycle in 2025.
- Heightened geopolitical tensions in Middle East failed to uplift the Silver price.
- The outlook of the Silver price has weakened amid a breakdown of the upward-sloping trendline around $30.00.

Silver price (XAG/USD) falls to near $29.60 in a thin trading volume session following holidays on Christmas and Boxing Day on Friday. The white metal is under pressure even though tensions in the Middle East region between Israel and Iran have escalated.
On Thursday, Israel launched missiles at the Iran-backed Houthis military and bombed Yemini airport. After the air assault, Israeli Prime Minister Benjamin Netanyahu said in an interview with an Israeli TV station of the Houthis, “We are just getting started with them”. Israel retaliated to last week’s air assault by Iran.
Historically, heightened geopolitical tensions improve the demand for safe-haven assets, such as Silver.
Meanwhile, the US Dollar Index (DXY), which tracks the Greenback’s value against six major currencies, oscillates in a tight range above the key support of 108.00. 10-year US Treasury yields rise to near 4.61%. Higher yields on interest-bearing assets elevate the opportunity cost of non-yielding assets, making them an expensive bet for investors.
US bond yields remain firm on expectations that the Federal Reserve (Fed) will deliver fewer interest rate cuts in 2025. The Fed is expected to slow down the policy-easing cycle amid confidence in the United States (US) economic outlook.
Silver technical analysis
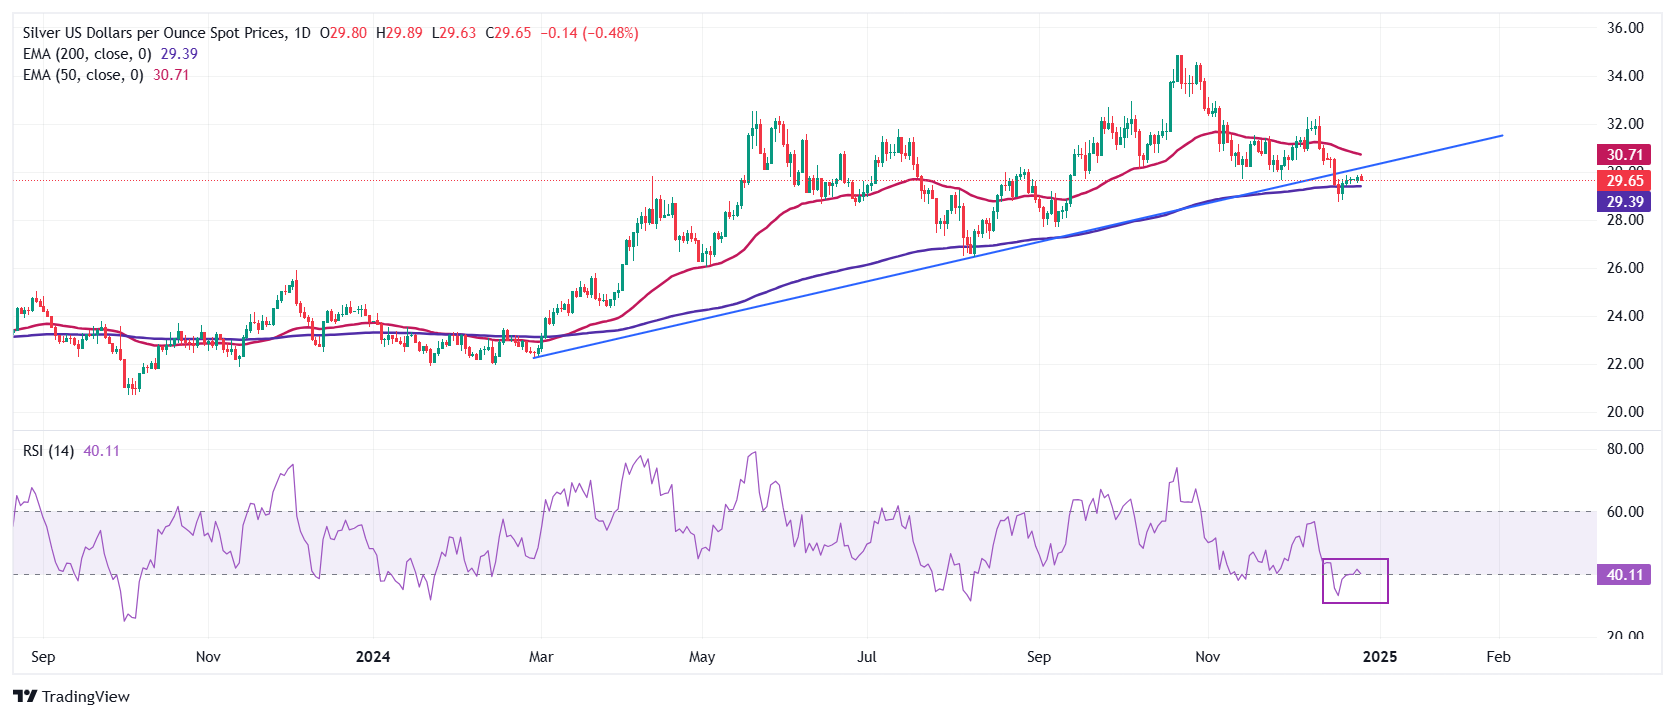
Silver price stays below the upward-sloping trendline, plotted from the February 29 low of $22.30 on a daily timeframe, after a breakdown near $30.00. The white metal wobbles around the 200-day Exponential Moving Average (EMA), suggesting that the longer-term outlook is uncertain.
The 14-day Relative Strength Index (RSI) rebounds to near 40.00. A fresh bearish momentum would trigger if it fails to break above that level.
Looking down, the September low of $27.75 would act as key support for the Silver price. On the upside, the 50-day EMA around $30.90 would be the barrier.
Silver daily chart
Silver FAQs
Silver is a precious metal highly traded among investors. It has been historically used as a store of value and a medium of exchange. Although less popular than Gold, traders may turn to Silver to diversify their investment portfolio, for its intrinsic value or as a potential hedge during high-inflation periods. Investors can buy physical Silver, in coins or in bars, or trade it through vehicles such as Exchange Traded Funds, which track its price on international markets.
Silver prices can move due to a wide range of factors. Geopolitical instability or fears of a deep recession can make Silver price escalate due to its safe-haven status, although to a lesser extent than Gold's. As a yieldless asset, Silver tends to rise with lower interest rates. Its moves also depend on how the US Dollar (USD) behaves as the asset is priced in dollars (XAG/USD). A strong Dollar tends to keep the price of Silver at bay, whereas a weaker Dollar is likely to propel prices up. Other factors such as investment demand, mining supply – Silver is much more abundant than Gold – and recycling rates can also affect prices.
Silver is widely used in industry, particularly in sectors such as electronics or solar energy, as it has one of the highest electric conductivity of all metals – more than Copper and Gold. A surge in demand can increase prices, while a decline tends to lower them. Dynamics in the US, Chinese and Indian economies can also contribute to price swings: for the US and particularly China, their big industrial sectors use Silver in various processes; in India, consumers’ demand for the precious metal for jewellery also plays a key role in setting prices.
Silver prices tend to follow Gold's moves. When Gold prices rise, Silver typically follows suit, as their status as safe-haven assets is similar. The Gold/Silver ratio, which shows the number of ounces of Silver needed to equal the value of one ounce of Gold, may help to determine the relative valuation between both metals. Some investors may consider a high ratio as an indicator that Silver is undervalued, or Gold is overvalued. On the contrary, a low ratio might suggest that Gold is undervalued relative to Silver.
Author

Sagar Dua
FXStreet
Sagar Dua is associated with the financial markets from his college days. Along with pursuing post-graduation in Commerce in 2014, he started his markets training with chart analysis.


