Silver Price Forecast: XAG/USD rallies to near $29 as Fed deeper rate cut bets swell
- Silver price jumps sharply to near $29.00 as the Fed is expected to deliver a bigger interest rate cut this month.
- Weak private sector employment data weighs on the US Dollar and bond yields.
- Investors await the US NFP data for August, which will be published on Friday.

Silver price (XAG/USD) delivers a vertical upside move to near $29.00 in Thursday’s North American session. The white metal witnesses a strong buying interest as surprisingly weak United States (US) ADP Employment Change data for August renewed fears of deteriorating labor market conditions.
The private employment data that came in the early American session showed that fresh payrolls were lower at 99K than the downwardly revised figure of 111K from 122K in July. Economists estimated fresh private payrolls to have increased to 145K.
Weak private sector employment data has prompted market speculation that the Federal Reserve (Fed) will start the policy-easing cycle this month aggressively. Signs of slowing labor market demand have weighed heavily on the US Dollar (USD) and bond yields.
The US Dollar Index (DXY), which tracks the Greenback’s value against six major currencies, declines to near 101.00. 10-year US Treasury yields plunge to near 3.73%. Lower yields on interest-bearing assets strengthen the appeal of non-yielding assets, such as Silver, given that they reduce the opportunity cost of holding investment in them.
Going forward, the US Nonfarm Payrolls (NFP) data for August will be keenly watched, which will be published on Friday. Meanwhile, investors await the US ISM Services PMI data for August, which will be published at 14:00 GMT.
Silver technical analysis
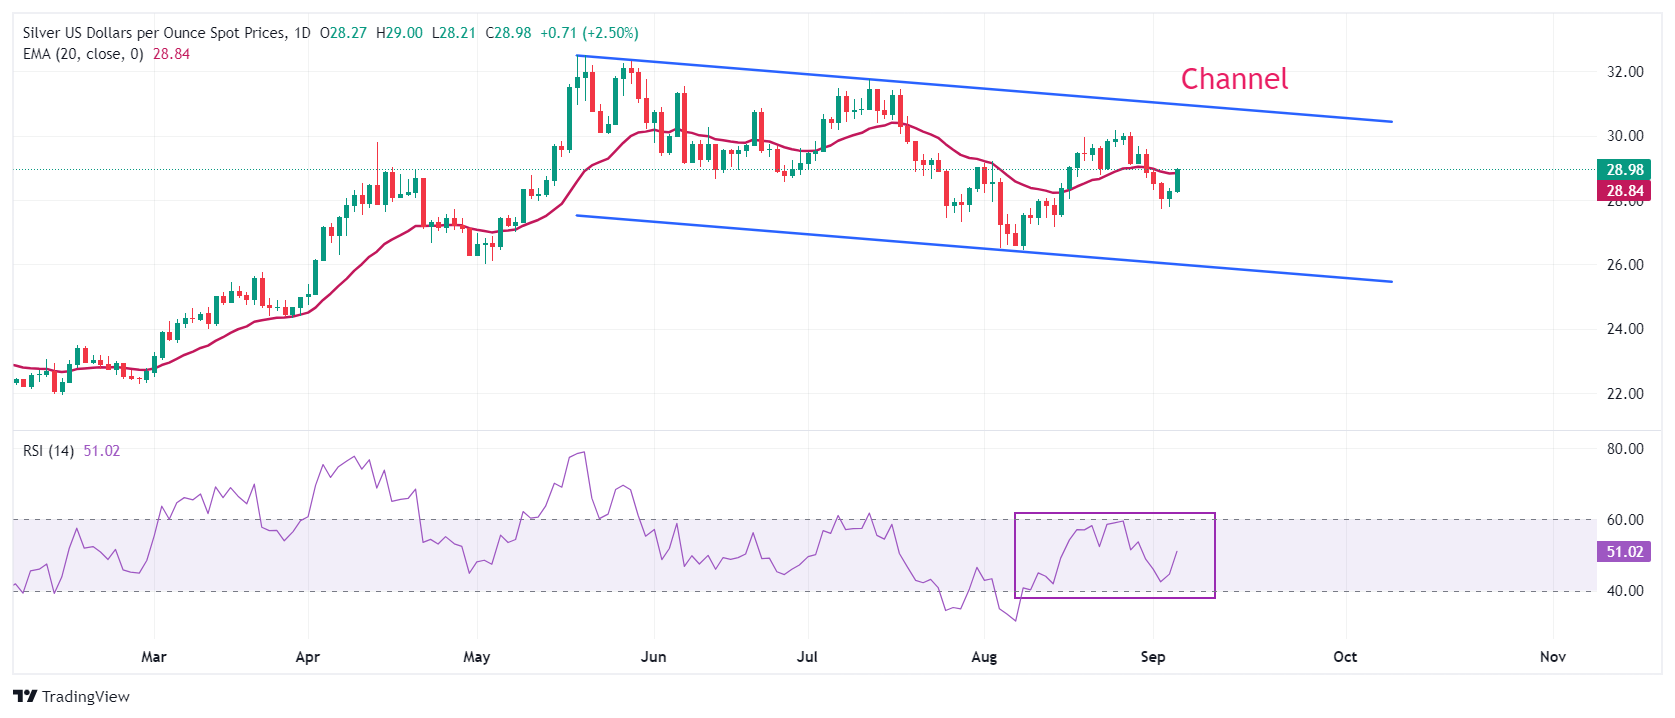
Silver price trades in a Channel formation on a daily timeframe, which is slightly sloping downwards. The asset recovers sharply and attempts to break above the 20-day Exponential Moving Average (EMA), which trades around $28.80.
The 14-day Relative Strength Index (RSI) oscillates inside the 40.00-60.00 range, suggesting a consolidation ahead.
Silver daily chart
Silver FAQs
Silver is a precious metal highly traded among investors. It has been historically used as a store of value and a medium of exchange. Although less popular than Gold, traders may turn to Silver to diversify their investment portfolio, for its intrinsic value or as a potential hedge during high-inflation periods. Investors can buy physical Silver, in coins or in bars, or trade it through vehicles such as Exchange Traded Funds, which track its price on international markets.
Silver prices can move due to a wide range of factors. Geopolitical instability or fears of a deep recession can make Silver price escalate due to its safe-haven status, although to a lesser extent than Gold's. As a yieldless asset, Silver tends to rise with lower interest rates. Its moves also depend on how the US Dollar (USD) behaves as the asset is priced in dollars (XAG/USD). A strong Dollar tends to keep the price of Silver at bay, whereas a weaker Dollar is likely to propel prices up. Other factors such as investment demand, mining supply – Silver is much more abundant than Gold – and recycling rates can also affect prices.
Silver is widely used in industry, particularly in sectors such as electronics or solar energy, as it has one of the highest electric conductivity of all metals – more than Copper and Gold. A surge in demand can increase prices, while a decline tends to lower them. Dynamics in the US, Chinese and Indian economies can also contribute to price swings: for the US and particularly China, their big industrial sectors use Silver in various processes; in India, consumers’ demand for the precious metal for jewellery also plays a key role in setting prices.
Silver prices tend to follow Gold's moves. When Gold prices rise, Silver typically follows suit, as their status as safe-haven assets is similar. The Gold/Silver ratio, which shows the number of ounces of Silver needed to equal the value of one ounce of Gold, may help to determine the relative valuation between both metals. Some investors may consider a high ratio as an indicator that Silver is undervalued, or Gold is overvalued. On the contrary, a low ratio might suggest that Gold is undervalued relative to Silver.
Author

Sagar Dua
FXStreet
Sagar Dua is associated with the financial markets from his college days. Along with pursuing post-graduation in Commerce in 2014, he started his markets training with chart analysis.


