Silver Price Forecast: XAG/USD oscillates above $30.00 with Trump’s inauguration on the horizon
- Silver price trades sideways above $30.00, with investors focusing on Trump’s inauguration ceremony.
- US Trump’s policies are expected to be pro-growth and inflationary for the economy.
- Easing geopolitical tensions in the Middle East region trim safe-haven demand.

Silver price (XAG/USD) trades in a tight range near $30.30 in Monday’s European session. The white metal consolidates as investors shift focus to United States (US) President-elect Donald Trump’s swearing ceremony.
Ahead of Trump’s inauguration, the US Dollar Index (DXY), which tracks the Greenback’s value against six major currencies, declines to near 109.00. 10-year US Treasury yields rise to near 4.64%. Higher yields on interest-bearing assets increase the opportunity cost of holding an investment in non-yielding assets, such as Silver. Generally, higher yields limit the upside in the Silver price.
Investors expect Donald Trump to tighten immigration policies, lower taxes, and raise import tariffs under his administration, which would boost growth and inflationary pressures in the United States (US) economy. This would force the Federal Reserve (Fed) to keep interest rates elevated for longer. Historically, the appeal of the Silver improves in a highly inflated environment. However, higher for longer interest rates bode poorly for Silver.
On the geopolitical front, easing tensions between Israel and Hamas in the Middle East has diminished safe-haven demand. Both nations released some hostages on Sunday, which appears to be a meaningful move to an end to the 15-month-old war in Gaza.
Silver technical analysis
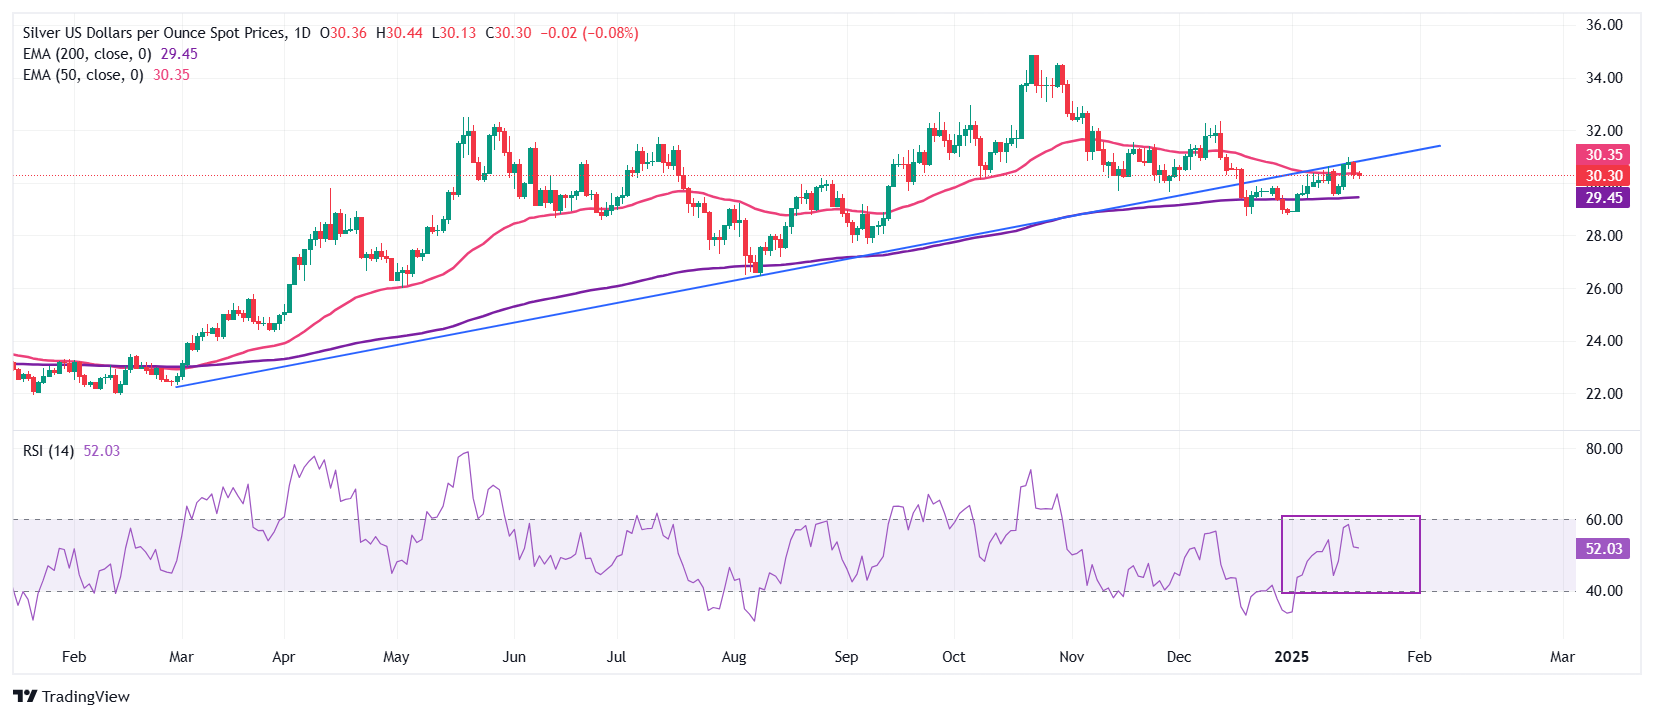
Silver price struggles near the upward-sloping trendline around $30.85, which is plotted from the 29 February 2024 low of $22.30 on a daily timeframe.
The white metal discovered strong buying interest near the 200-day Exponential Moving Average (EMA) around $29.45 but struggles to sustain above the 50-day EMA, which is around $30.30.
The 14-day Relative Strength Index (RSI) faces pressure near 60.00. A fresh bullish momentum would trigger if it manages to break above 60.00.
Silver daily chart
Silver FAQs
Silver is a precious metal highly traded among investors. It has been historically used as a store of value and a medium of exchange. Although less popular than Gold, traders may turn to Silver to diversify their investment portfolio, for its intrinsic value or as a potential hedge during high-inflation periods. Investors can buy physical Silver, in coins or in bars, or trade it through vehicles such as Exchange Traded Funds, which track its price on international markets.
Silver prices can move due to a wide range of factors. Geopolitical instability or fears of a deep recession can make Silver price escalate due to its safe-haven status, although to a lesser extent than Gold's. As a yieldless asset, Silver tends to rise with lower interest rates. Its moves also depend on how the US Dollar (USD) behaves as the asset is priced in dollars (XAG/USD). A strong Dollar tends to keep the price of Silver at bay, whereas a weaker Dollar is likely to propel prices up. Other factors such as investment demand, mining supply – Silver is much more abundant than Gold – and recycling rates can also affect prices.
Silver is widely used in industry, particularly in sectors such as electronics or solar energy, as it has one of the highest electric conductivity of all metals – more than Copper and Gold. A surge in demand can increase prices, while a decline tends to lower them. Dynamics in the US, Chinese and Indian economies can also contribute to price swings: for the US and particularly China, their big industrial sectors use Silver in various processes; in India, consumers’ demand for the precious metal for jewellery also plays a key role in setting prices.
Silver prices tend to follow Gold's moves. When Gold prices rise, Silver typically follows suit, as their status as safe-haven assets is similar. The Gold/Silver ratio, which shows the number of ounces of Silver needed to equal the value of one ounce of Gold, may help to determine the relative valuation between both metals. Some investors may consider a high ratio as an indicator that Silver is undervalued, or Gold is overvalued. On the contrary, a low ratio might suggest that Gold is undervalued relative to Silver.
Author

Sagar Dua
FXStreet
Sagar Dua is associated with the financial markets from his college days. Along with pursuing post-graduation in Commerce in 2014, he started his markets training with chart analysis.


