|

Silver Price Forecast: XAG/USD holds key support of $29 as cooler US CPI boosts Fed rate-cut bets

  • Silver price gains ground above $29.00 as soft US price pressures weigh on bond yields.
  • Traders price in two rate cuts this year against one signaled by the Fed.
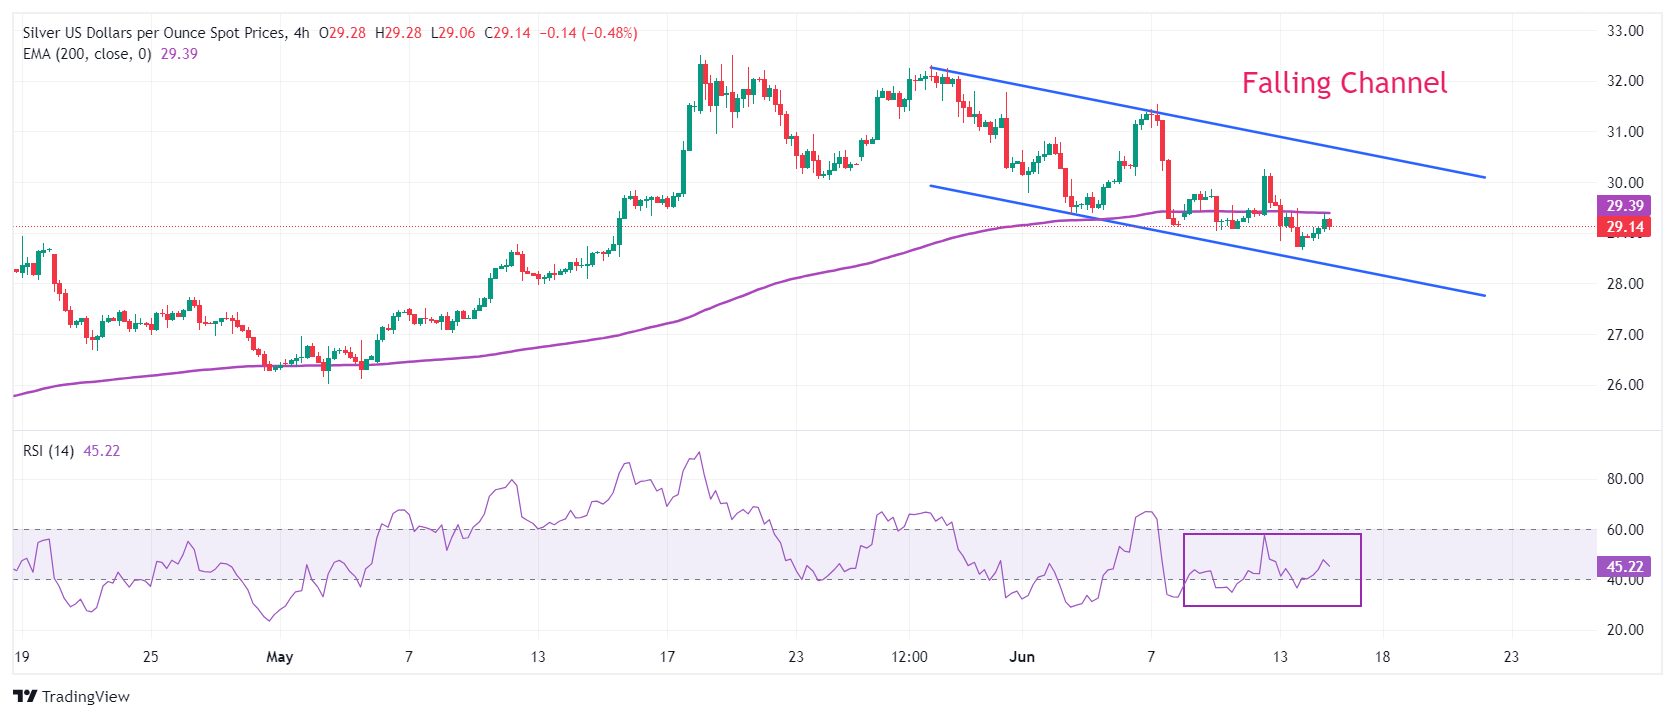
  • Silver price trades in a Falling Channel formation.

Silver price (XAG/USD) clings to key support of $29.00 in Friday’s American session. The white metal rebounds as US bond yields come under pressure due to improved speculation that the Federal Reserve (Fed) will start reducing interest rates from the September meeting.

10-year US Treasury yields have dropped to near 4.20%. Lower yields on interest-bearish assets reduce the opportunity cost of holding an investment in non-yielding assets, such as Silver.

The CME FedWatch tool shows that the probability for rate cuts in September has improved to almost 71% from 50.4% recorded a week ago. Market expectations for Fed rate cuts have risen as the United States (US) consumer and produce inflation decline on monthly and an annual basis in May. Major contribution to decline in price pressures came from soft gasoline prices.

The CME FedWatch Tool also shows that there will be two rate cuts this year against one signalled by Fed policymakers in their latest dot plot. Fed officials lowered potential number of rate cuts in the forecast report from three forecasted in March as they were concerned over inflation remaining stubborn due to strong labor market conditions.

Meanwhile, the US Dollar Index (DXY), which tracks the Greenback’s value against six major currencies, jumps to 105.70.

Silver technical analysis

Silver price trades inside Thursday’s trading range. The white metal trades in a Falling Channel chart pattern in which each pullback is considered as selling opportunity by market participants. The asset has dropped below the 200-period Exponential Moving Average (EMA), which trades around $29.40, indicating the overall trend has turned bearish.

The 14-period Relative Strength Index (RSI) oscillates in the 40.00-60.00 range, suggesting a consolidating ahead.

Silver four-hour chart

XAG/USD

Overview
Today last price29.16
Today Daily Change0.20
Today Daily Change %0.69
Today daily open28.96
 
Trends
Daily SMA2030.62
Daily SMA5028.93
Daily SMA10026.34
Daily SMA20024.75
 
Levels
Previous Daily High29.73
Previous Daily Low28.66
Previous Weekly High31.55
Previous Weekly Low29.12
Previous Monthly High32.51
Previous Monthly Low26.02
Daily Fibonacci 38.2%29.07
Daily Fibonacci 61.8%29.32
Daily Pivot Point S128.5
Daily Pivot Point S228.04
Daily Pivot Point S327.43
Daily Pivot Point R129.58
Daily Pivot Point R230.19
Daily Pivot Point R330.66

Author

Sagar Dua

Sagar Dua

FXStreet

Sagar Dua is associated with the financial markets from his college days. Along with pursuing post-graduation in Commerce in 2014, he started his markets training with chart analysis.

More from Sagar Dua
Share:

Editor's Picks

AUD/USD eyes 0.7150 barrier nine-day EMA

AUD/USD inches higher after registering modest losses in the previous day, trading around 0.7130 during the Asian hours. The technical analysis of the daily chart indicates that the pair is moving sideways within the rectangle pattern, suggesting a consolidation as neither the bulls nor the bears have enough momentum to take control of the market.

USD/JPY trades below 160.00 intervention threshold; bullish bias intact

The USD/JPY pair attracts some sellers during the Asian session amid fears that authorities will step in again to prop up the Japanese Yen. Furthermore, the Israel-Lebanon truce prompts some profit-taking around the US Dollar and exerts downward pressure on the currency pair.

Gold puts its 200-day SMA to the test near $4,420

Gold keeps the bullish stance in place in the latter part of Thursday’s session, although a convincing break above the key $4,500 mark per troy ounce still remains elusive. The precious metal’s advance comes amid the resurgence of some selling interest around the Greenback, improving risk sentiment, and declining US Treasury yields across the board.

Bitcoin’s massive storm is back: Why the sell-off is far from over

Bitcoin price action over the last few weeks has felt less like a normal, healthy correction and more like a slow grinding crash that continues to wreak havoc on holdings and trading accounts. And everything suggests that the dramatic crash isn’t over.

Nonfarm payrolls: Testing the limits of Fed policy patience

The upcoming nonfarm payrolls report for May will provide the final update on the US labor market before Kevin Warsh attends his first policy meeting as the new Fed Chair later this month.

Recession on paper: What really moves the Canadian Loonie now?

Statistics Canada handed the headline writers a gift and the analysts a headache. Real GDP shrank 0.1% on an annualized basis in the first quarter, and with the fourth quarter of 2025 revised down to a 1.0% contraction, that is two negative quarters in a row, the textbook definition of a technical recession and Canada's first since the pandemic.