Silver Price Forecast: XAG/USD holds ground near $31 as Fed rate-cut bets soar
- Silver price remains firm as US Treasury yields are under pressure fur to rising Fed rate-cut bets.
- Loosening US labor market strength weighs on the US Dollar and bond yields.
- The U Unemployment Rate rose to its highest in more than two years at 4.1%.

Silver price (XAG/USD) trades inside Monday’s trading range near $31.00 in Tuesday’s Asian session. The white metal exhibits sheer strength as a rate cut by the Federal Reserve (Fed) in September appears to be a done deal.
The CME FedWatch tool shows that traders see a 77% chance for rate cuts in September, which has increased from 65.6% recorded a week ago. The reasoning behind growing speculation for rate cuts is moderating United States (US) labor market conditions.
The US Nonfarm Payrolls (NFP) report for June showed that the Unemployment Rate rose to 4.1%, the highest in more than two years. Also, Average Hourly Earnings declined expectedly, which eases fears of inflation remaining stubborn as slower growth in purchasing power would keep a lid over consumer spending.
Increasing expectations for Fed rate cuts in September have limited the upside in the US Dollar (USD) and Treasury yields. The US Dollar Index (DXY), which tracks the Greenback’s value against six major currencies, remains on backfoot around three-week low near 104.85. 10-year US Treasury yields struggle to hold weekly support of 4.28%. Falling yields on interest-bearing assets reduces the opportunity cost of holding an investment in non-yielding assets, such as Silver.
Silver technical analysis
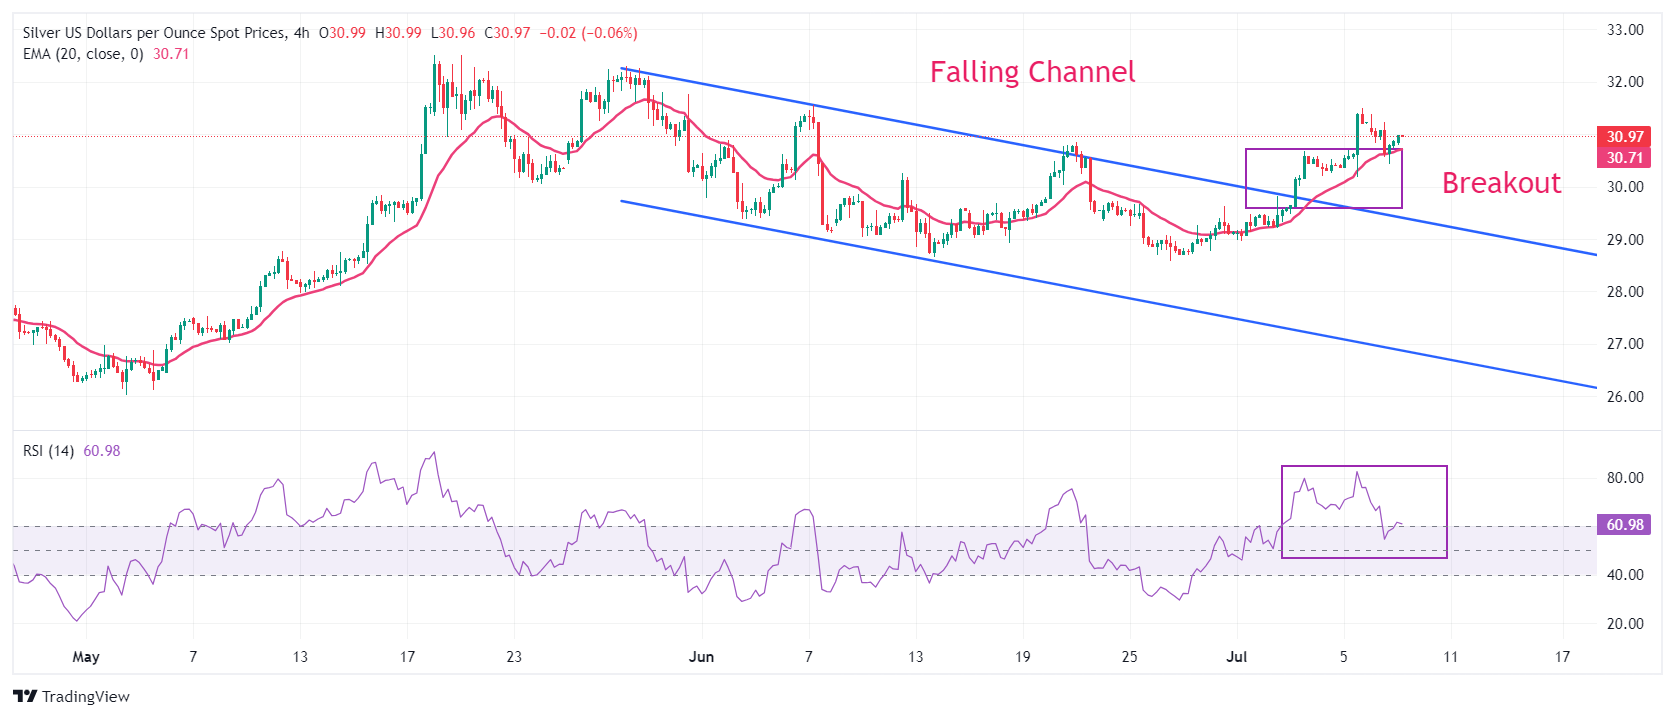
Silver price extends its upside to near $31.00 after a breakout of the Falling Channel formation on a four-hour timeframe. An upside break of the above-mentioned chart pattern results in a bullish reversal. Upward-sloping 20-day Exponential Moving Average (EMA) at $30.70, exhibits a bullish trend.
The 14-period Relative Strength Index (RSI) shifts into the bullish range of 60.00-80.00, indicating that momentum has shifted to the upside.
Silver four-hour chart
Silver FAQs
Silver is a precious metal highly traded among investors. It has been historically used as a store of value and a medium of exchange. Although less popular than Gold, traders may turn to Silver to diversify their investment portfolio, for its intrinsic value or as a potential hedge during high-inflation periods. Investors can buy physical Silver, in coins or in bars, or trade it through vehicles such as Exchange Traded Funds, which track its price on international markets.
Silver prices can move due to a wide range of factors. Geopolitical instability or fears of a deep recession can make Silver price escalate due to its safe-haven status, although to a lesser extent than Gold's. As a yieldless asset, Silver tends to rise with lower interest rates. Its moves also depend on how the US Dollar (USD) behaves as the asset is priced in dollars (XAG/USD). A strong Dollar tends to keep the price of Silver at bay, whereas a weaker Dollar is likely to propel prices up. Other factors such as investment demand, mining supply – Silver is much more abundant than Gold – and recycling rates can also affect prices.
Silver is widely used in industry, particularly in sectors such as electronics or solar energy, as it has one of the highest electric conductivity of all metals – more than Copper and Gold. A surge in demand can increase prices, while a decline tends to lower them. Dynamics in the US, Chinese and Indian economies can also contribute to price swings: for the US and particularly China, their big industrial sectors use Silver in various processes; in India, consumers’ demand for the precious metal for jewellery also plays a key role in setting prices.
Silver prices tend to follow Gold's moves. When Gold prices rise, Silver typically follows suit, as their status as safe-haven assets is similar. The Gold/Silver ratio, which shows the number of ounces of Silver needed to equal the value of one ounce of Gold, may help to determine the relative valuation between both metals. Some investors may consider a high ratio as an indicator that Silver is undervalued, or Gold is overvalued. On the contrary, a low ratio might suggest that Gold is undervalued relative to Silver.
Author

Sagar Dua
FXStreet
Sagar Dua is associated with the financial markets from his college days. Along with pursuing post-graduation in Commerce in 2014, he started his markets training with chart analysis.


