|

Silver Price Forecast: XAG/USD extends recovery to $30.60 on firm Fed rate-cut prospects

  • Silver price rises to $30.60 as US yields fall on backfoot amid firm Fed rate-cut bets.
  • Fed rate-cut bets for September have been prompted by easing US labor market strength.
  • Investors shift focus to the US NFP report for May for fresh guidance.

Silver price (XAG/USD) recovers further to $30.60 in Thursday’s Asian session. The white metal discovers strong buying interest as normalizing United States (US) labor market conditions boost speculation that the Federal Reserve (Fed) will start reducing interest rates in the September meeting.

The CME FedWatch tool shows that traders see a 68% chance for rate cuts in September. The probability has significantly improved from 47% recorded a week ago. This has weighed heavily on US bond yields. 10-year US Treasury yields are slightly up to near 4.29% but have come down significantly from weekly high of 4.64%. A sharp decline in yields on interest bearing assets reduces the opportunity cost of holding an investment in non-yielding assets, such as Silver.

Investors lose confidence over US labor market strength after weak JOLTS Job Openings data for April and lower-than-expected ADP Employment Change for May.

The US Dollar Index (DXY) falls sharply after failing to extend recovery above 104.40 but holds the immediate support of 104.00. The next move in above-mentioned assets will be influenced by the US Nonfarm Payrolls (NFP) report for May, which will be published on Friday.

Silver technical analysis

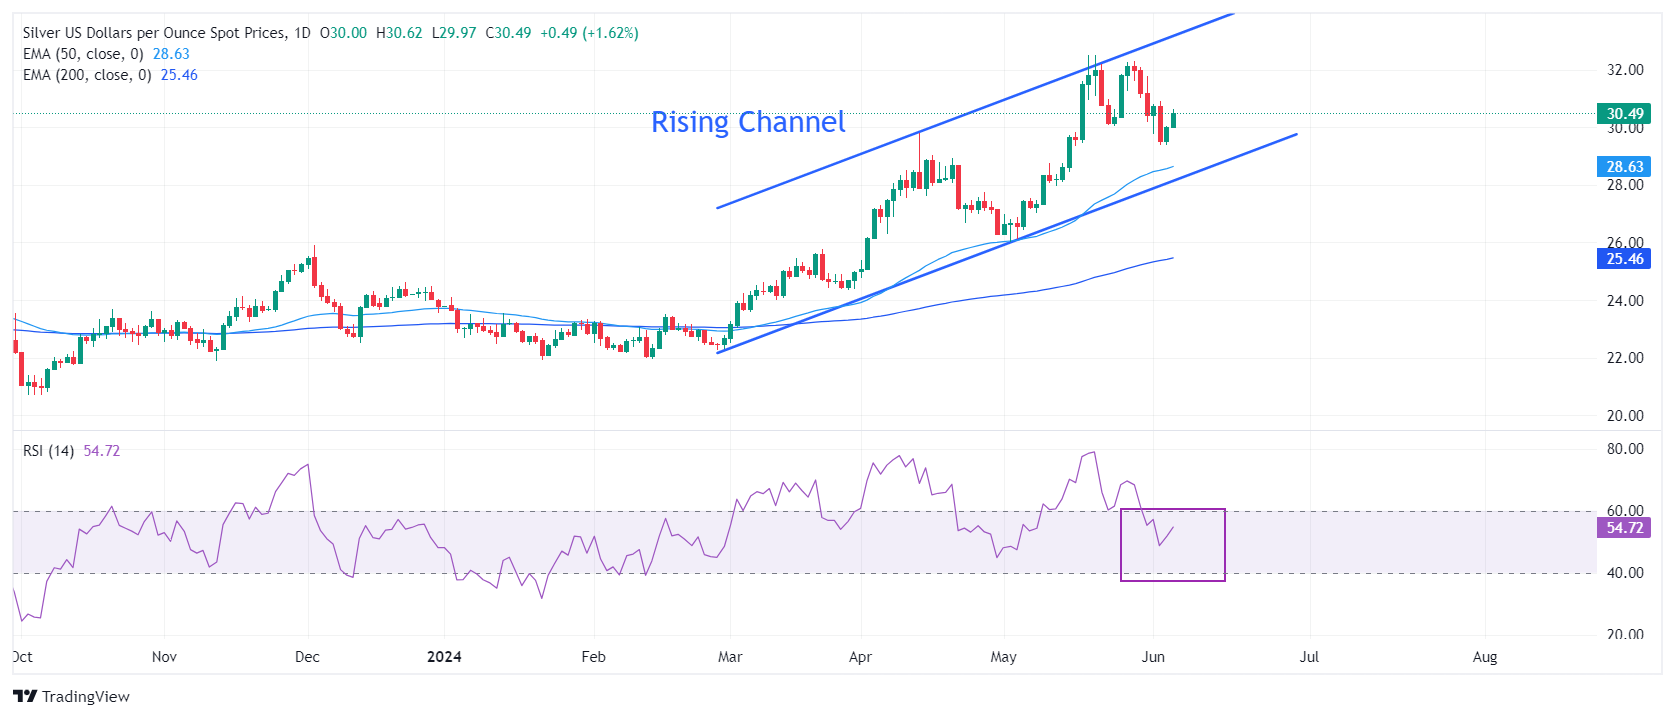
Silver price trades in a Rising Channel chart formation on a daily timeframe in which each pullback is considered as buying opportunity by market participants. Advancing 50 and 200-day Exponential Moving Averages (EMAs) around $28.63 and $25.46, respectively, indicate that the overall trend is bullish.

The 14-period Relative Strength Index (RSI) falls back into the 40.00-60.00 range, suggesting that upside momentum has faded. However, the upside bias remains intact.

Silver daily chart

XAG/USD

Overview
Today last price30.45
Today Daily Change0.45
Today Daily Change %1.50
Today daily open30
 
Trends
Daily SMA2030.34
Daily SMA5028.47
Daily SMA10025.91
Daily SMA20024.57
 
Levels
Previous Daily High30.05
Previous Daily Low29.39
Previous Weekly High32.3
Previous Weekly Low30.19
Previous Monthly High32.51
Previous Monthly Low26.02
Daily Fibonacci 38.2%29.8
Daily Fibonacci 61.8%29.64
Daily Pivot Point S129.58
Daily Pivot Point S229.16
Daily Pivot Point S328.92
Daily Pivot Point R130.24
Daily Pivot Point R230.47
Daily Pivot Point R330.9

Author

Sagar Dua

Sagar Dua

FXStreet

Sagar Dua is associated with the financial markets from his college days. Along with pursuing post-graduation in Commerce in 2014, he started his markets training with chart analysis.

More from Sagar Dua
Share:

Editor's Picks

AUD/USD eyes 0.7150 barrier nine-day EMA

AUD/USD inches higher after registering modest losses in the previous day, trading around 0.7130 during the Asian hours. The technical analysis of the daily chart indicates that the pair is moving sideways within the rectangle pattern, suggesting a consolidation as neither the bulls nor the bears have enough momentum to take control of the market.

USD/JPY trades below 160.00 intervention threshold; bullish bias intact

The USD/JPY pair attracts some sellers during the Asian session amid fears that authorities will step in again to prop up the Japanese Yen. Furthermore, the Israel-Lebanon truce prompts some profit-taking around the US Dollar and exerts downward pressure on the currency pair.

Gold defends 200-day SMA at $4,425, but for how long?

Gold is attempting a tepid recovery toward $4,500 early Thursday, as renewed optimism in the Mideast geopolitical front calms market nerves. This cautious optimism across Asian markets weighs on Oil prices, and diminishes the US Dollar’s safe-haven appeal, helping Gold stage a decent comeback from the weekly low of $4,424.


Hyperliquid: ETF demand, capital rotation fuel HYPE rally as Bitcoin melts

Hyperliquid price sustains an upward trend near its all-time high of $75.76 on Thursday after posting 80% gains in May, while Bitcoin (BTC) retraces below $65,000, triggering a market-wide panic.

Kevin Warsh takes the Fed helm: What it means for the US Dollar
The Federal Reserve moves away from the highly predictable "forward guidance" model of the Jerome Powell era to a new “Kevin Warsh environment”, characterized by less communication, more policy surprises, and an increased focus on the Fed's complex balance sheet.
Recession on paper: What really moves the Canadian Loonie now?

Statistics Canada handed the headline writers a gift and the analysts a headache. Real GDP shrank 0.1% on an annualized basis in the first quarter, and with the fourth quarter of 2025 revised down to a 1.0% contraction, that is two negative quarters in a row, the textbook definition of a technical recession and Canada's first since the pandemic.