Silver Price Forecast: XAG/USD drops to near $29.50, facing pressure from Fed’s moderate hawkish stance
- Silver price falls to near $29.50 amid firm US Treasury yields.
- US bond yields trade near more than a six-month high as the Fed guided fewer rate cuts in 2025.
- Silver price remains broadly weak amid a breakdown of the upward-sloping trendline.

Silver price (XAG/USD) falls to near $29.30 in Tuesday’s European session, though it remains inside Monday’s trading range amid thin trading volume due to holidays on Wednesday and Thursday on account of Christmas Eve and Thanksgiving Day. The white metal is broadly under pressure as the Federal Reserve (Fed) has guided a moderate hawkish stance on the monetary policy outlook.
The Fed has shifted from “dovish” to “cautionary” on interest rates as progress in the disinflation trend has stalled in the last three months, and labor market conditions are not as bad as they appeared in the September meeting. Additionally, policymakers see incoming immigration, tariff, and tax policies from US President-elect Donald Trump as inflationary for the economy.
In the latest dot plot, the Fed guided two interest rate cuts for 2025, which analysts at UBS see coming in June and September.
Meanwhile, the US Dollar Index (DXY), which tracks the Greenback’s value against six major currencies, oscillates in a tight range above 108.00. 10-year US Treasury yields wobble near a more-than-six-month high of around 4.6%. Firm yields on interest-bearing assets weigh on non-yielding assets, such as Silver, as they result in higher opportunity costs for them.
Silver technical analysis
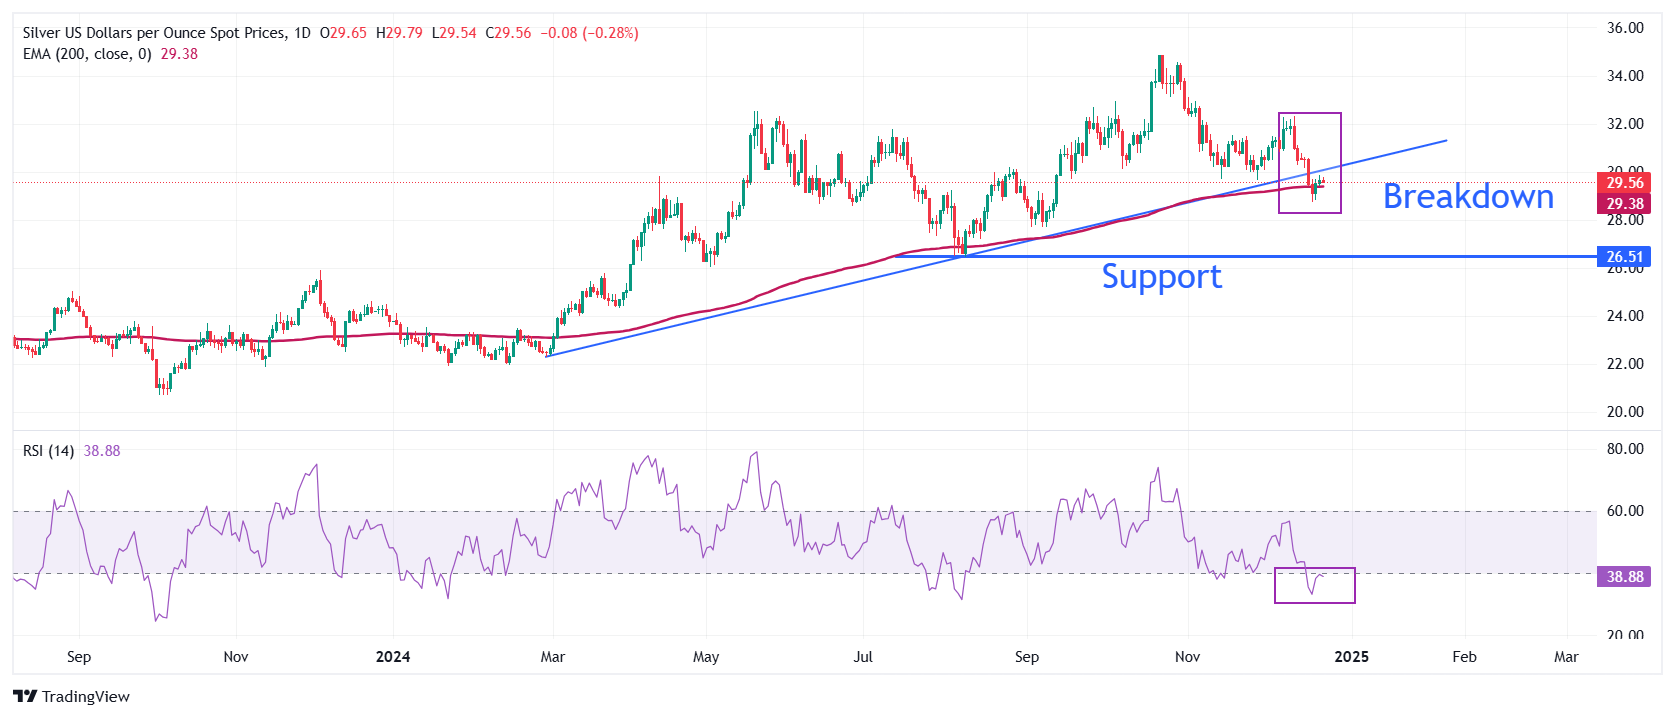
Silver price stays below the upward-sloping trendline, plotted from the February 29 low of $22.30 on a daily timeframe, after a breakdown near $30.00. The white metal wobbles around the 200-day Exponential Moving Average (EMA), suggesting that the longer-term outlook is uncertain.
The 14-day Relative Strength Index (RSI) rebounds to near 40.00. A fresh bearish momentum would trigger if it fails to break above that level.
Looking down, the September low of $27.75 would act as key support for the Silver price. On the upside, the 50-day EMA around $30.90 would be the barrier.
Silver daily chart
Silver FAQs
Silver is a precious metal highly traded among investors. It has been historically used as a store of value and a medium of exchange. Although less popular than Gold, traders may turn to Silver to diversify their investment portfolio, for its intrinsic value or as a potential hedge during high-inflation periods. Investors can buy physical Silver, in coins or in bars, or trade it through vehicles such as Exchange Traded Funds, which track its price on international markets.
Silver prices can move due to a wide range of factors. Geopolitical instability or fears of a deep recession can make Silver price escalate due to its safe-haven status, although to a lesser extent than Gold's. As a yieldless asset, Silver tends to rise with lower interest rates. Its moves also depend on how the US Dollar (USD) behaves as the asset is priced in dollars (XAG/USD). A strong Dollar tends to keep the price of Silver at bay, whereas a weaker Dollar is likely to propel prices up. Other factors such as investment demand, mining supply – Silver is much more abundant than Gold – and recycling rates can also affect prices.
Silver is widely used in industry, particularly in sectors such as electronics or solar energy, as it has one of the highest electric conductivity of all metals – more than Copper and Gold. A surge in demand can increase prices, while a decline tends to lower them. Dynamics in the US, Chinese and Indian economies can also contribute to price swings: for the US and particularly China, their big industrial sectors use Silver in various processes; in India, consumers’ demand for the precious metal for jewellery also plays a key role in setting prices.
Silver prices tend to follow Gold's moves. When Gold prices rise, Silver typically follows suit, as their status as safe-haven assets is similar. The Gold/Silver ratio, which shows the number of ounces of Silver needed to equal the value of one ounce of Gold, may help to determine the relative valuation between both metals. Some investors may consider a high ratio as an indicator that Silver is undervalued, or Gold is overvalued. On the contrary, a low ratio might suggest that Gold is undervalued relative to Silver.
Author

Sagar Dua
FXStreet
Sagar Dua is associated with the financial markets from his college days. Along with pursuing post-graduation in Commerce in 2014, he started his markets training with chart analysis.


